 |
VOOZH | about |
|
VOOZH | about |
Problem Statement: The task is to build a network intrusion detector, a predictive model capable of distinguishing between bad connections, called intrusions or attacks, and good normal connections.
Intrusion Detection System is a software application that detects network intrusion using various machine learning algorithms. IDS monitors a network or system for malicious activity and protects a computer network from unauthorized access by users, including perhaps insiders. The intrusion detector learning task is to build a predictive model (i.e., a classifier) capable of distinguishing between 'bad connections' (intrusion/attacks) and 'good (normal) connections'. Attacks fall into four main categories:
You can download the dataset used in this project from Kaggle (the name of the dataset is Intrusion Detection System Using Machine Learning).
Dataset Description: Data files:
Features:
| feature name | description | type |
| duration | length (number of seconds) of the connection | continuous |
| protocol_type | type of the protocol, e.g, TCP, UDP, etc. | discrete |
| service | network service on the destination, e.g., HTTP, telnet, etc. | discrete |
| src_bytes | number of data bytes from source to destination | continuous |
| dst_bytes | number of data bytes from destination to source | continuous |
| flag | normal or error status of the connection | discrete |
| land | 1 if connection is from/to the same host/port; 0 otherwise | discrete |
| wrong_fragment | number of ``wrong'' fragments | continuous |
| urgent | number of urgent packets | continuous |
Table 1: Basic features of individual TCP connections.
| feature name | description | type |
| hot | number of ``hot'' indicators | continuous |
| num_failed_logins | number of failed login attempts | continuous |
| logged_in | 1 if successfully logged in; 0 otherwise | discrete |
| num_compromised | number of ``compromised'' conditions | continuous |
| root_shell | 1 if root shell is obtained; 0 otherwise | discrete |
| su_attempted | 1 if ``su root'' command attempted; 0 otherwise | discrete |
| num_root | number of ``root'' accesses | continuous |
| num_file_creations | number of file creation operations | continuous |
| num_shells | number of shell prompts | continuous |
| num_access_files | number of operations on access control files | continuous |
| num_outbound_cmds | number of outbound commands in an ftp session | continuous |
| is_hot_login | 1 if the login belongs to the ``hot'' list; 0 otherwise | discrete |
| is_guest_login | 1 if the login is a ``guest''login; 0 otherwise | discrete |
Table 2: Content features within a connection suggested by domain knowledge.
| feature name | description | type |
| count | number of connections to the same host as the current connection in the past two seconds | continuous |
| Note: The following features refer to these same-host connections. | ||
| serror_rate | % of connections that have ``SYN'' errors | continuous |
| rerror_rate | % of connections that have ``REJ'' errors | continuous |
| same_srv_rate | % of connections to the same service | continuous |
| diff_srv_rate | % of connections to different services | continuous |
| srv_count | number of connections to the same service as the current connection in the past two seconds | continuous |
| Note: The following features refer to these same-service connections. | ||
| srv_serror_rate | % of connections that have ``SYN'' errors | continuous |
| srv_rerror_rate | % of connections that have ``REJ'' errors | continuous |
| srv_diff_host_rate | % of connections to different hosts | continuous |
Table 3: Traffic features computed using a two-second time window.
Various Algorithms Applied: Gaussian Naive Bayes, Decision Tree, Random Forest, Support Vector Machine, Logistic Regression.
Approach Used: I have applied various classification algorithms that are mentioned above on the KDD dataset and compare there results to build a predictive model.
Code: Importing libraries and reading features list.
Output:
Appending columns to the dataset and adding a new column name 'target' to the dataset.
Output:
42
Reading the 'attack_types' file.
Output:
Creating a dictionary of attack_types
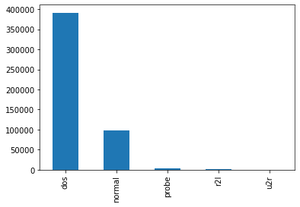
Reading the dataset('kddcup.data_10_percent_corrected") and adding Attack Type feature in the training dataset where attack type feature has 5 distinct values i.e. dos, normal, probe, r2l, u2r.
Output:
Shape of dataframe and getting data type of each feature
Output:
(494021, 43)
Finding missing values of all features.
Output:
No missing value found, so we can further proceed to our next step.
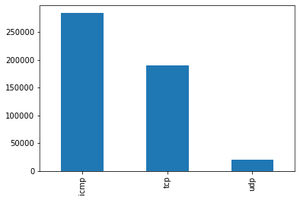
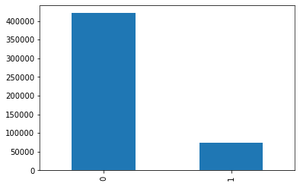
Finding Categorical Features
Output:
['service', 'protocol_type', 'flag']
Visualizing Categorical Features using bar graph
Output:
Shape of X_train: (330994, 41), X_test: (163027, 41
Shape of y_train: (330994, 1), y_test: (163027, 1)
Output:
Dropping Columns that don't provide high value:
Correlation Matrix with transformed dataset:
Output:
Output:
Shape of X_train after scaling: (330994, 30)
Shape of X_test after scaling: (163027, 30)
Output:
You can download the ipynb file for the complete code from here.