 |
VOOZH | about |
|
VOOZH | about |
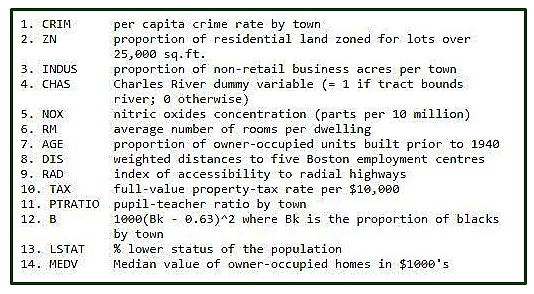
Boston Housing Data: This dataset was taken from the StatLib library and is maintained by Carnegie Mellon University. This dataset concerns the housing prices in the housing city of Boston. The dataset provided has 506 instances with 13 features.
The Description of the dataset is taken from the below reference as shown in the table follows:
Let's make the Linear Regression Model, predicting housing prices by Inputting Libraries and datasets.
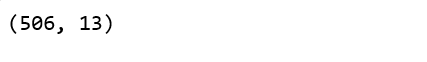
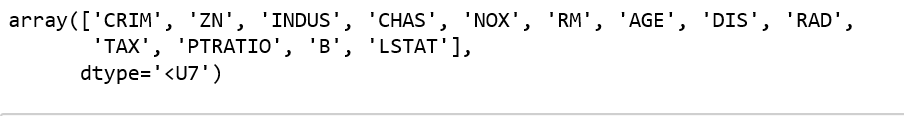
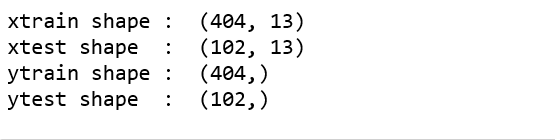
The shape of input Boston data and getting feature_names.
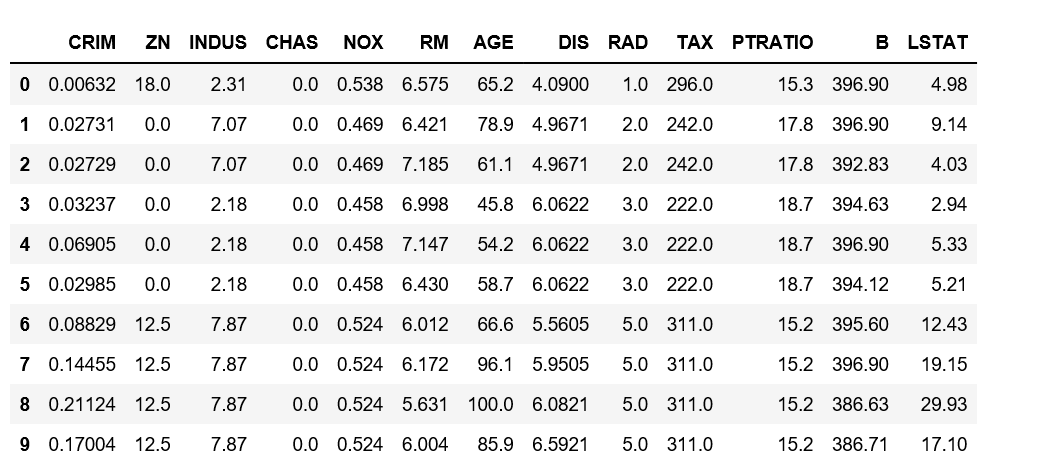
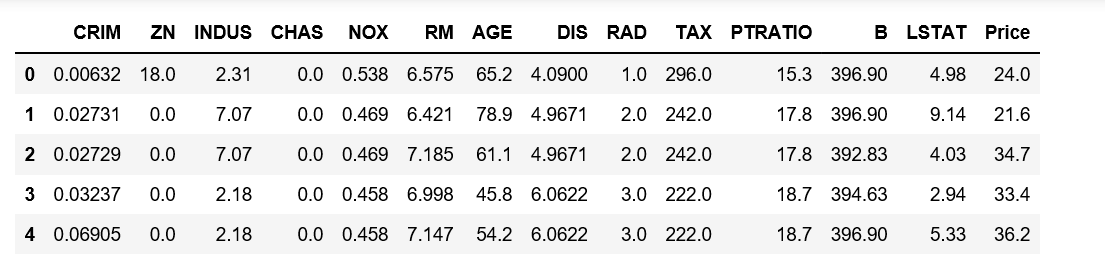
Converting data from nd-array to data frame and adding feature names to the data
Adding the 'Price' column to the dataset
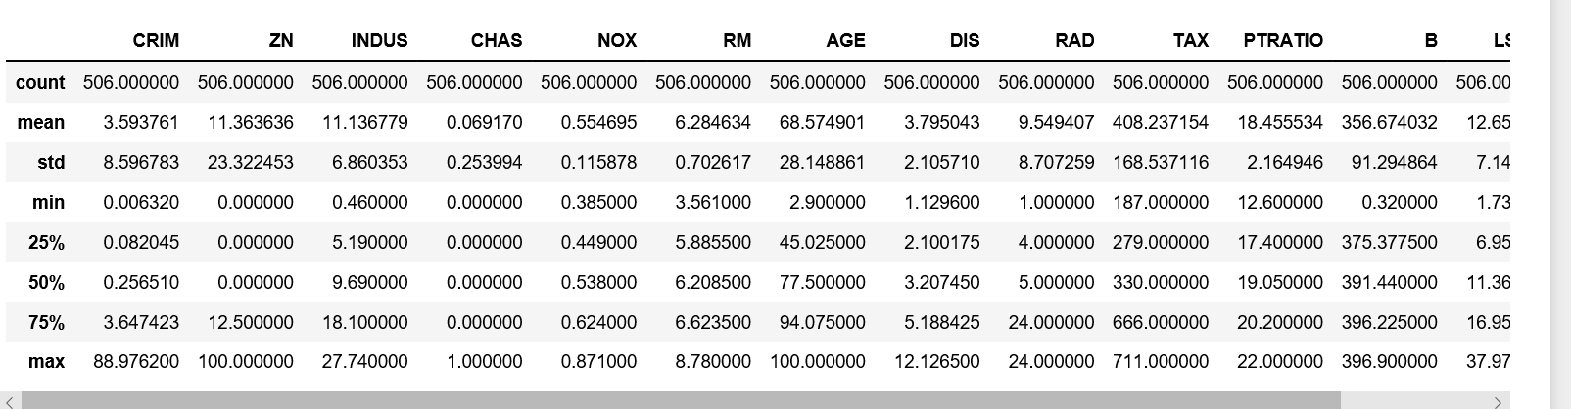
Description of Boston dataset
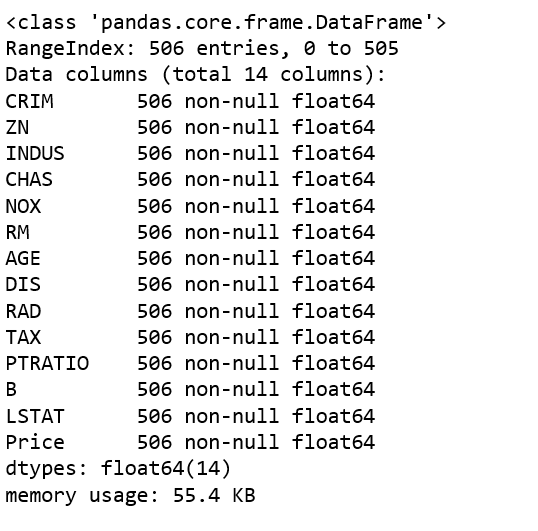
Info of Boston Dataset
Getting input and output data and further splitting data to training and testing dataset.
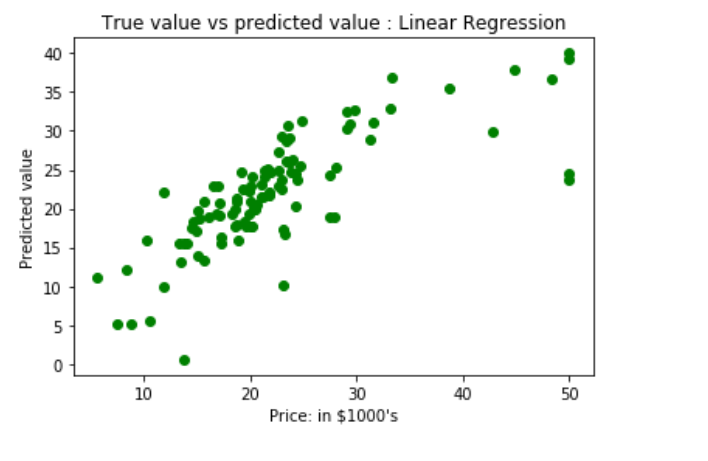
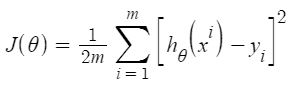
Applying Linear Regression Model to the dataset and predicting the prices.
Plotting Scatter graph to show the prediction results - 'y_true' value vs 'y_pred' value.
Results of Linear Regression i.e. Mean Squared Error and Mean Absolute Error.
Mean Square Error : 33.448979997676496
Mean Absolute Error : 3.8429092204444966
As per the result, our model is only 66.55% accurate. So, the prepared model is not very good for predicting housing prices. One can improve the prediction results using many other possible machine learning algorithms and techniques.
Here are a few further steps on how you can improve your model.