 |
VOOZH | about |
|
VOOZH | about |
RMSE: Root Mean Square Error is the measure of how well a regression line fits the data points. RMSE can also be construed as Standard Deviation in the residuals.
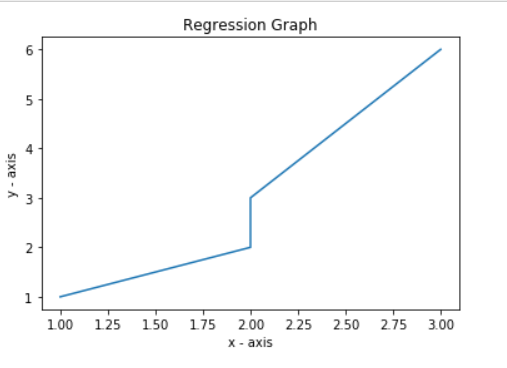
Consider the given data points: (1, 1), (2, 2), (2, 3), (3, 6).
Let us break the above data points into 1-d lists.
Input:
x = [1, 2, 2, 3]
y = [1, 2, 3, 6]
Code: Regression Graph
Output:
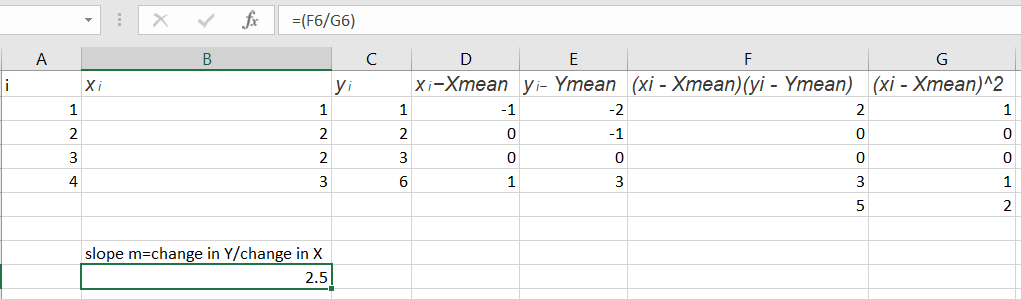
Code: Mean Calculation
Output :
Value of X mean 2.0
value of Y mean 3.0
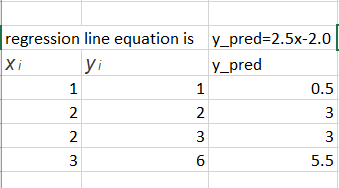
Code: Line Equation
Output:
Intercept -2.0
Code: Mean Squared Error
Output:
Output:
Root mean square error 0.6123724356957945
Code : RMSE Calculation
Output:
Output:
Root Mean square error using maths 0.6123724356957945
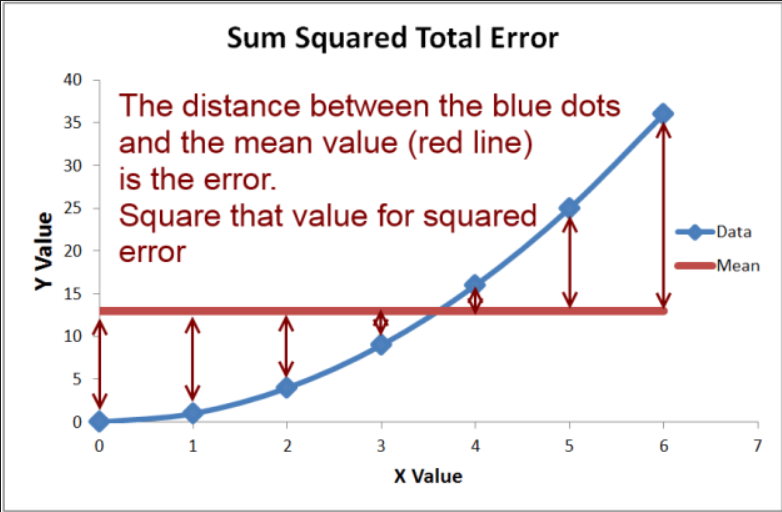
R-squared Error or Coefficient of Determination
R2 error answers the below question.
How much y varies with variation in x.Basically the % variation of y on variation with x
Code: R-Squared Error
('val', 0.25, 1.0, 0.0, 0.25)
('Rsquared error', 0.8928571428571429)
Code: R-Squared Error with sklearn
Output:
0.8928571428571429