 |
VOOZH | about |
|
VOOZH | about |
Validation curves are essential tools in machine learning for diagnosing model performance and understanding the impact of hyperparameters on model accuracy. This article will delve into the concept of validation curves, their importance, and how to implement them using Scikit-learn in Python.
Table of Content
A validation curve is a graphical representation that shows the relationship between a model's performance and a specific hyperparameter. It helps in understanding how changes in hyperparameters affect the training and validation scores of a model. The curve typically plots the model performance metric (such as accuracy, F1-score, or mean squared error) on the y-axis and a range of hyperparameter values on the x-axis.
We have a table which describes various scenarios of the two scores of validation and training.
Training Score | Validation Score | Estimator is: |
|---|---|---|
Low | Low | Underfitting |
High | Low | Overfitting |
Low | High | (Not Possible) |
Validation curves are crucial for several reasons:
Before diving into the implementation, it's essential to understand the concepts of bias and variance:
Step 1: Import Required Libraries
First, we need to import the necessary libraries. We'll use Scikit-learn for model building and Matplotlib for plotting.
Step 2: Load the Dataset
For this example, we'll use the digits dataset from Scikit-learn.
Step 3: Define the Hyperparameter Range
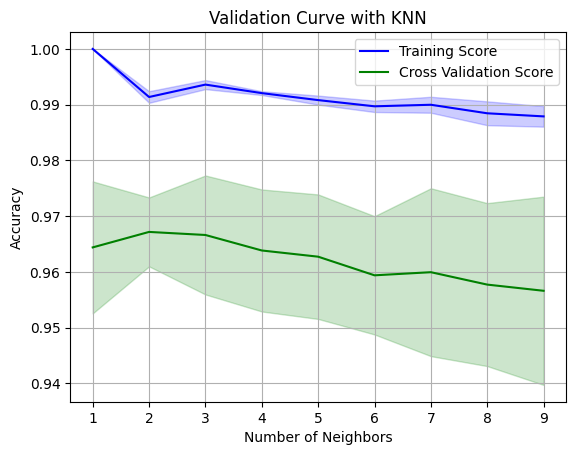
We'll define the range of hyperparameter values we want to evaluate. In this case, we'll vary the number of neighbors (n_neighbors) for the K-Nearest Neighbors (KNN) classifier.
Step 4: Calculate Training and Validation Scores
We'll use the validation_curve function from Scikit-learn to calculate the training and validation scores for each value of the hyperparameter.
Step 5: Calculate Mean and Standard Deviation
Next, we'll calculate the mean and standard deviation of the training and validation scores.
Step 6: Plot the Validation Curve
Finally, we'll plot the validation curve using Matplotlib.
Output:
Interpreting the results of a validation curve can sometimes be tricky. Here are some key points to keep in mind:
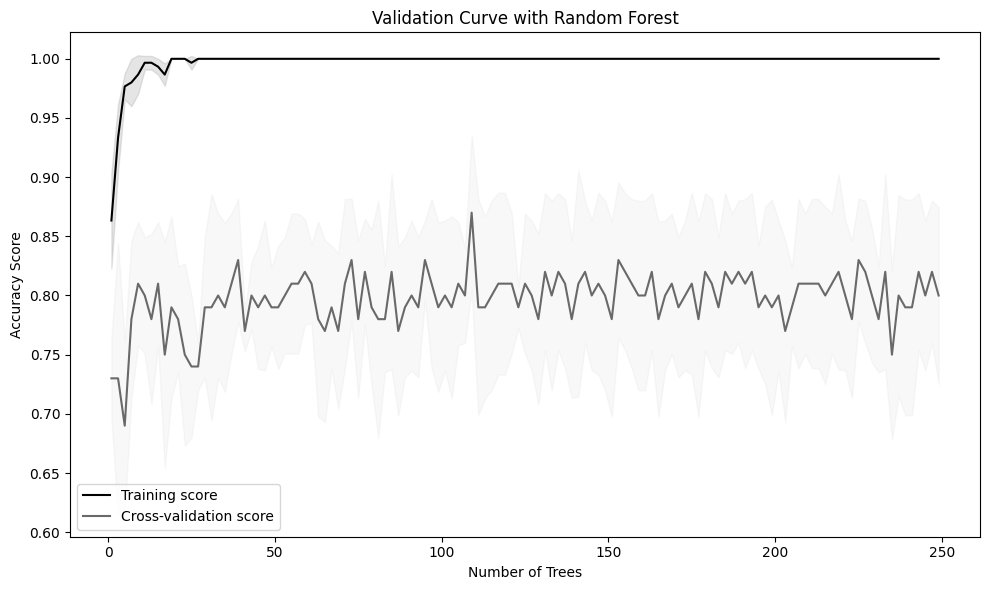
Let's consider another example using the RandomForestClassifier and varying the number of trees (n_estimators).
Output:
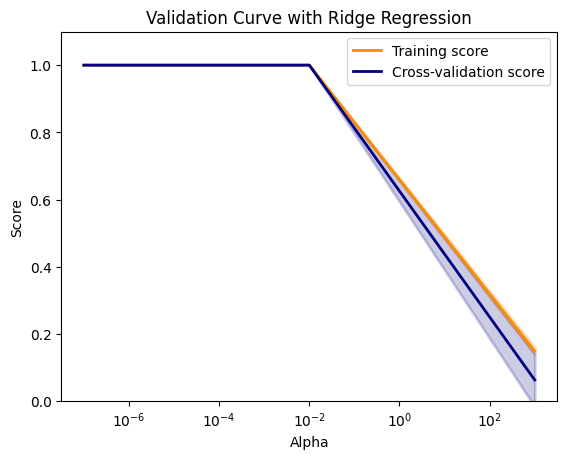
Output:
Validation curves are powerful tools for diagnosing model performance and understanding the impact of hyperparameters. By using Scikit-learn and visualization libraries like Matplotlib and Yellowbrick, you can effectively create and interpret validation curves to improve your machine learning models. Understanding and utilizing validation curves will help you build models that generalize well to unseen data, ultimately leading to more robust and accurate predictions.