 |
VOOZH | about |
|
VOOZH | about |
The Silhouette Score is a metric used to evaluate the quality of clustering results. It measures how similar each data point is to its own cluster compared to other clusters, helping assess how well the data has been grouped. This score is widely used to evaluate clustering algorithms like K-Means.
The Silhouette Score measures how well each data point fits within its assigned cluster and how well-separated it is from other clusters. For each point, two key quantities are calculated:
The silhouette score for a data point combines these two distances to quantify clustering quality:
The score ranges from -1 to +1:
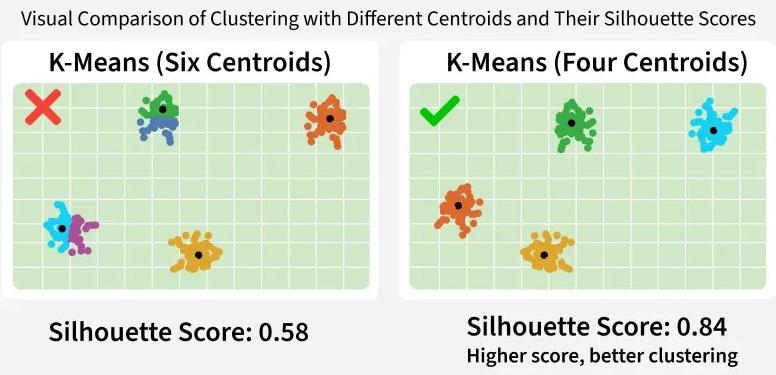
The image below compares K-Means clustering using 6 centroids vs. 4 centroids. The clustering with 4 centroids has a higher Silhouette Score (0.84), indicating better-defined clusters.
In this example, we will create a synthetic dataset using random numbers and apply K-Means clustering. Then, we will calculate the Silhouette Score.
We need NumPy for generating random data, and scikit-learn for clustering and calculating the Silhouette Score.
We create three separate groups of data points, where each group represents one cluster. The data points are spread around different centers using the normal distribution.
We merge all three groups into a single dataset to prepare it for clustering.
We create the K-Means model to form 3 clusters and assign each data point to one of the clusters.
We calculate the Silhouette Score to evaluate how well the clustering worked.
Output:
Silhouette Score: 0.6808642416167786
The Silhouette Score of 0.68 shows that the clustering worked well, with points fitting well into their own clusters and clearly separated from others. A score above 0.5 usually means good clustering, and values close to 1.0 indicate strong separation. Since the data was generated with clear cluster centers, this result is expected.