YFinance is a Python library that helps in accessing financial data from Yahoo Finance. It is widely used by investors, analysts and developers to find stock prices, historical market data and financial statements. In this article, we will see more about yfinance and its core concepts.
It helps users to download historical stock data and company financial statements making it an invaluable library for those who all are involved in financial analysis or data science. It allows users to quickly access comprehensive market data through a user-friendly Python interface. It also offers a reliable and accessible method for working with financial data. Key Features of yfinance:
Historical Market Data: It help users to download open, high, low, close, adjusted close prices and trading volumes over a specific time period. This is useful for tracking price trends and performing technical analysis.
Corporate Actions: It provides information about corporate actions such as stock splits and other events that can impact stock prices. This is important for accurate financial analysis when adjusting for dividends and stock splits.
Financial Statements: It allows users to access important financial statements such as balance sheets, income statements and cash flow statements. This is valuable for analyzing the finances of a companies.
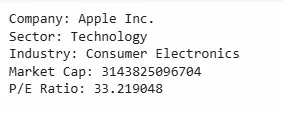
Meta Data: It also includes earnings dates, revenue and earnings per share (EPS) which are key factors of a company’s performance.
Multiple Tickers: It supports downloading data for multiple tickers simultaneously which makes it convenient to analyze portfolios or compare performance of various stocks.
Getting started with yfinance in Python
If we want to use YFinance we need to install it in python. We can install YFinance with the following pip command:
pip install yfinance
There are various examples for its use case:
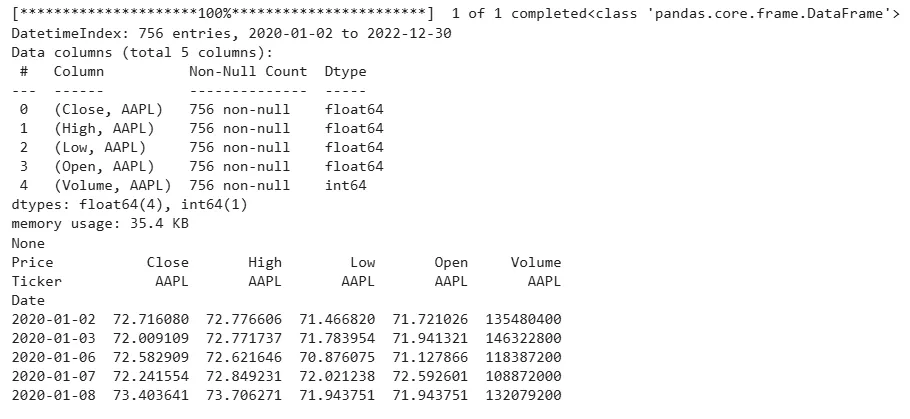
Example 1: Downloading Historical Stock Data
One of the most common uses of yfinance is to download historical market data for a given ticker symbol. Here’s an example that shows how to download Apple’s stock data between January 1, 2020, and January 1, 2023.
yf.download(ticker, start, end): Downloads historical data for the specified ticker between the start and end dates and AAPL means apple ticker.
We can also find real-time stock price data using yfinance. There are various ticker symbols for popular companies across various industries:
Apple - AAPL
Microsoft Corporation - MSFT
Tesla - TSLA
Amazon - AMZN
yf.Ticker(ticker): Creating a Ticker object for the specified ticker symbol.
history(period="1d"): Retrieves historical data for the last trading day.
['Close'][0]: Extracts the closing price of the stock for the last trading day.
Output:
Real-time price for AAPL: 209.27999877929688
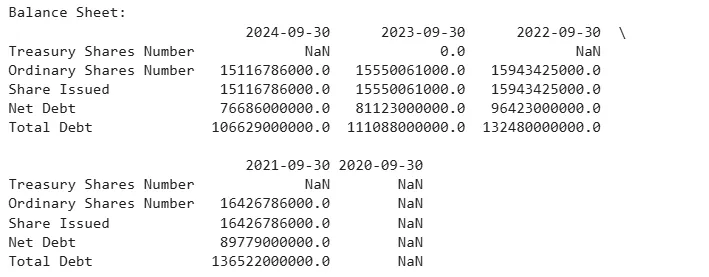
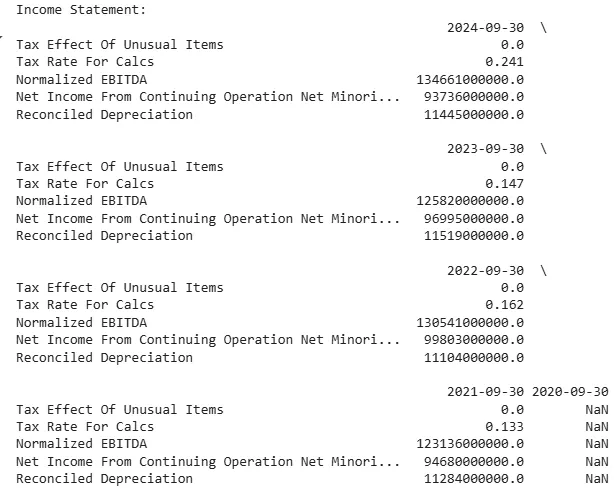
Example 3: Retrieving Financial Statements
It provides access to a company’s financial statements such as balance sheets, income statements and cash flow statements. Here we will get Apple’s balance sheet and income statement:
It has a variety of applications in finance and data analysis fields:
Backtesting Trading Strategies: This involves using historical data to identify how our chosen indicators and trading techniques perform in actual trading.
Portfolio Management: Assist in tracking and evaluating results of investing with the help of portfolio tracking software.
Market Analysis: Research to see trends in various markets and assess performance of the sectors.
Financial Modeling: Develop and analyze numerical models using real-time and historical data for valuation and forecasting.
By using YFinance we can efficiently access and analyze a wide range of financial data which helps in better decision-making and deeper insights into market trends.
