Matplotlib was introduced keeping in mind, only two-dimensional plotting. But at the time when the release of 1.0 occurred, the 3d utilities were developed upon the 2d and thus, we have 3d implementation of data available today! The 3d plots are enabled by importing the
mplot3d toolkit. Let's look at a 3d contour diagram of a 3d cosine function. The code is attached for reference.
| Function Arguments |
Description |
| meshgrid |
Function of numpy used to create a rectangular grid out of two given one-dimensional arrays representing the Cartesian indexing or Matrix indexing |
| plt.axes() |
To create object of the axis |
| ax.contour3D |
To form the contour |
| ax.set_xlabel |
To label the X-axis |
| ax.set_title |
To give a title to the plot |
Example 1:
Output:
👁 3D Contour Plotting
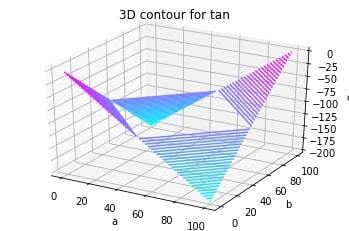
Example 2: Let's look at another 3d diagram for better understanding of the concept. This time, of a 3d tan function.
