 |
VOOZH | about |
|
VOOZH | about |
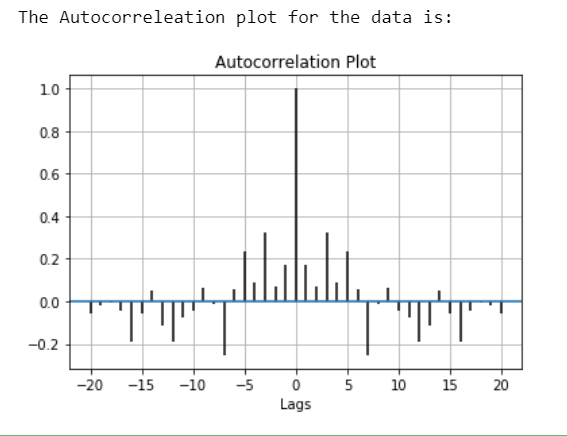
Autocorrelation plots are a commonly used tool for checking randomness in a data set. This randomness is ascertained by computing autocorrelations for data values at varying time lags.
Characteristics Of Autocorrelation Plot :
Application of Autocorrelation:
To plot the Autocorrelation Plot we can use matplotlib and plot it easily by using matplotlib.pyplot.acorr() function.
Syntax: matplotlib.pyplot.acorr(x, *, data=None, **kwargs)
Parameters:
- 'x' : This parameter is a sequence of scalar.
- 'detrend' : This parameter is an optional parameter. Its default value is mlab.detrend_none.
- 'normed' : This parameter is also an optional parameter and contains the bool value. Its default value is True.
- 'usevlines' : This parameter is also an optional parameter and contains the bool value. Its default value is True.
- 'maxlags' : This parameter is also an optional parameter and contains the integer value. Its default value is 10.
- 'linestyle' : This parameter is also an optional parameter and used for plotting the data points, only when usevlines is False.
- 'marker' : This parameter is also an optional parameter and contains the string. Its default value is ‘o’.
Returns: (lags, c, line, b)
Where:
- lags are a length 2`maxlags+1 lag vector.
- c is the 2`maxlags+1 auto correlation vector.
- line is a Line2D instance returned by plot.
- b is the x-axis.
Example 1:
Output:
👁 Image
Example 2: