 |
VOOZH | about |
|
VOOZH | about |
In statistics, covariance measures how variables vary together, while correlation standardizes this relationship to a value between -1 and 1, making it easier to interpret. In this article, we will be discussing relationship between Covariance and Correlation and program our own function for calculating covariance and correlation using python.
Correlation is just normalized Covariance refer to the formula below:
where are the standard deviation of x and y respectively.
We will use the Iris dataset for demonstration. The goal is to first compute the covariance matrix manually and then convert it to a correlation matrix.
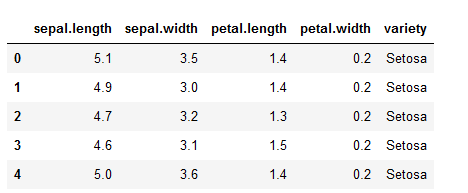
1. Loading and displaying the dataset
Output
👁 irisDatasetIn this example, we exclude the target column (species) since we only want numeric features:
2. Define a Function to Calculate Covariance Between Two Variables
The covariance between two variables x and y measures how much they vary together.
Explanation:
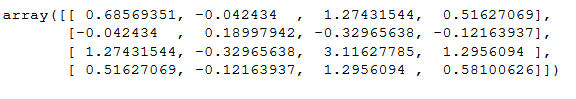
3. Compute the Covariance Matrix
We can now build the full covariance matrix for all numeric features.
Output
👁 Output_1Explanation:
This manual calculation matches the NumPy function:
rowvar=False ensures columns are treated as features and rows as observations.
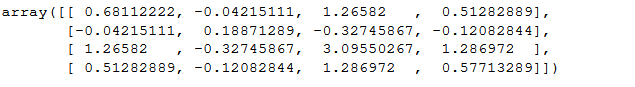
Output
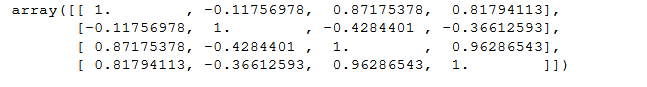
👁 Output_24. Convert Covariance Matrix to Correlation Matrix
Correlation is simply normalized covariance, dividing by the standard deviations of each variable.
Output
👁 Output_3Explanation:
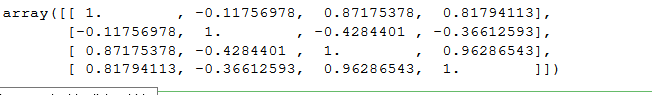
5. Verify Using NumPy