 |
VOOZH | about |
|
VOOZH | about |
Counting values in Pandas dataframe is important for understanding the distribution of data, checking for missing values or summarizing data. In this article, we will learn various methods to count values in a Pandas DataFrame.
We will be using a sample DataFrame to learn about various methods:
Output:
To count the unique values in a specific column of a DataFrame we can use the nunique() method. This method returns the number of unique values in the column.
Output:
3
There are 3 unique names ('Alice', 'Bob' and 'Charlie').
Pandas provides the count() method to count non-null values in a DataFrame or a specific column. This method excludes NaN values.
Output:
6
Here count() tells us that there are 6 non-null entries in the 'Age' column.
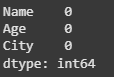
To count the number of missing or null values in a DataFrame we can use the isnull() function along with sum(). This combination will return the count of missing values in each column.
Output:
In this example there are no missing values in the DataFrame, as indicated by the zeros in the output. To count missing values in a specific column:
Output:
0
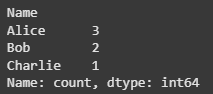
The value_counts() method is frequently used functions for counting values in a Pandas DataFrame. It returns the frequency of unique values in a column ordered by the frequency of occurrences.
Output:
Here we see that 'Alice' appears 3 times, 'Bob' appears twice and 'Charlie' appears once.
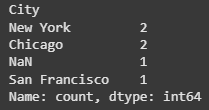
By default value_counts() excludes NaN values. If we want to include NaN in the count pass the dropna=False argument:
Output:
The output shows the count of unique values in the 'City' column including NaN as a distinct value.
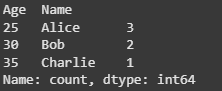
We can also count values in different groups using the groupby() method. This is useful when we want to count occurrences of values within each category of another column.
Output:
The output displays the count of names within each age group showing how many times each name appears for each age.