OpenCV is not just for image processing it can also be used for creating and manipulating geometric shapes. we’ll take three vertices of a triangle, draw triangle on a black window, calculate its centroid and mark it visually.
Problem Statement Given three vertices of a triangle, find its centroid using formula:
Then, draw the triangle and highlight its centroid using OpenCV.
Refer to this article for Draw geometric shapes on images using OpenCV .
Example The given vertices form a triangle whose centroid is calculated as average of their x and y coordinates, resulting in (150, 116) .
Input: (100, 200), (50, 50), (300, 100) Output: (150, 116)
Libraries Required OpenCV : for drawing shapes and displaying images. NumPy : for creating a black image canvas. Install them if needed:
pip install opencv-python numpy
Step-by-Step Approach Create a black window of resolution 400 x 300 with three color channels. Draw the triangle by connecting the given vertices with cv2.line() . Calculate the centroid using the average of all x and y coordinates. Draw the centroid as a small green circle using cv2.circle() . Display the image with cv2.imshow() . Implementation This code creates a triangle on a black canvas using OpenCV, calculates its centroid and marks the centroid with a green dot.
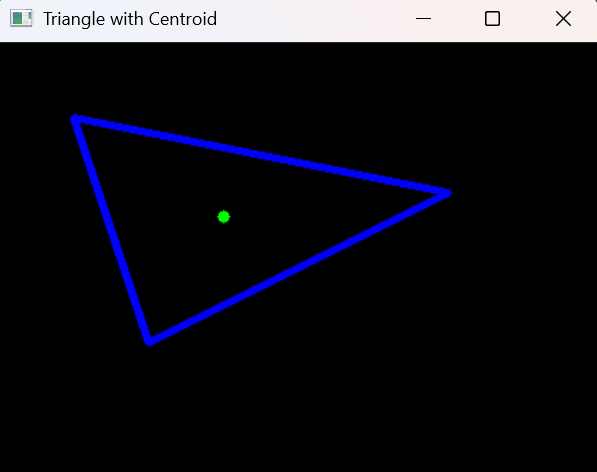
Output
Centroid: (150, 116)
👁 triangleWithCentroid Output Explanation:
np.zeros((height, width, 3), np.uint8): Creates a black image of given size. p1, p2, p3: Defines the three vertices of the triangle. cv2.line(img, p1, p2, (255, 0, 0), 3): Draws a blue line from p1 to p2. cv2.line(img, p2, p3, (255, 0, 0), 3): Draws a blue line from p2 to p3. cv2.line(img, p1, p3, (255, 0, 0), 3): Draws a blue line from p1 to p3. ((p1[0]+p2[0]+p3[0])//3, (p1[1]+p2[1]+p3[1])//3): Calculates centroid coordinates using the average of x and y values. cv2.circle(img, centroid, 4, (0, 255, 0), -1): Draws a filled green circle at the centroid. Real-World Uses Computer Vision Annotations: Marking center points of detected objects. Geometry Simulations: Visualizing points, lines and shapes. Educational Tools: Teaching geometry with visuals. 