VOOZH about

URL: https://www.geeksforgeeks.org/python/grids-in-matplotlib/

⇱ Grids in Matplotlib - GeeksforGeeks


  • Courses
  • Tutorials
  • Interview Prep

Grids in Matplotlib

Last Updated : 22 Jan, 2026

Grids in Matplotlib are intersecting lines that provide a structured reference for data points, improving readability and interpretation of plots. grid() function in the Pyplot module is used to configure grid lines in a plot.

Syntax

matplotlib.pyplot.grid(b=True, color='grey', linewidth=1.4, axis='', linestyle='-.')

Parameters:

  • b (True/False): Whether to display the grid.
  • color: Color of the grid lines.
  • linewidth: Thickness of the grid lines.
  • axis: Which axis to apply the grid ('x', 'y', or both).
  • linestyle: Style of grid lines (e.g., dashed, dotted, dash-dot).

Returns: It does not return anything; it modifies the existing plot by adding a grid.

Adding Grid Lines to a Plot

grid() function can enable or disable grid lines, display major or minor grid lines, and customize color, linewidth, and linestyle.

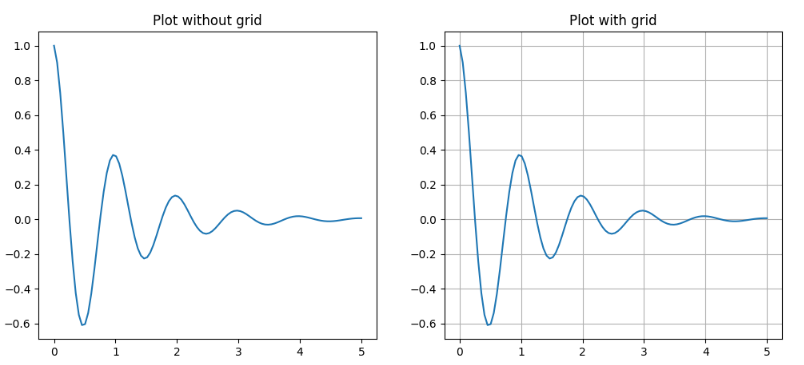
Example 1: Grid vs No Grid

Output

👁 g4

Explanation:

  • ax1: shows the plot without grid lines.
  • ax2.grid(True): enables grid lines for the second subplot.

Customizing Grid Lines

You can modify color, linewidth, and linestyle for better visualization.

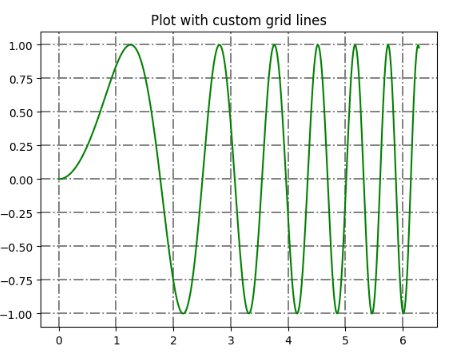
Example 2: Custom Grid Lines

Output

👁 g3

Explanation:

  • x = np.linspace(0, 2 * np.pi, 400): Create 400 points from 0 to 2π.
  • y = np.sin(x ** 2): Compute sine of squared x values.
  • plt.grid(True, color='grey', linewidth=1.4, linestyle='-.'): Display grid lines with grey color, width 1.4, and dash-dot style.

Displaying Grid Lines for Specific Axes

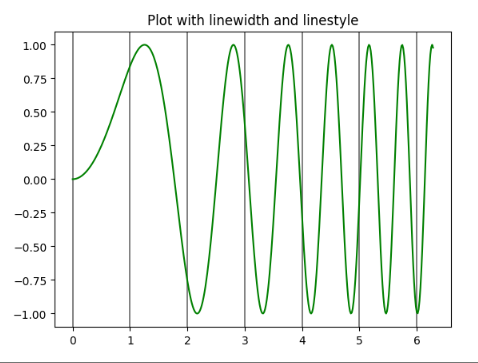
Matplotlib allows us to display gridlines only for the x-axis or y-axis.

1. Display Lines on X-Axis Only

Use axis='x' to enable grid lines only along the x-axis.

Output

👁 g2

Explanation:

  • x = np.linspace(0, 2 * np.pi, 400): Create 400 points from 0 to 2π.
  • y = np.sin(x ** 2): Compute sine of squared x values.
  • plt.grid(True, color="grey", linewidth=1.4, axis='x'): Display vertical grid lines corresponding to x-axis values.

2. Display Lines on y-axis Only

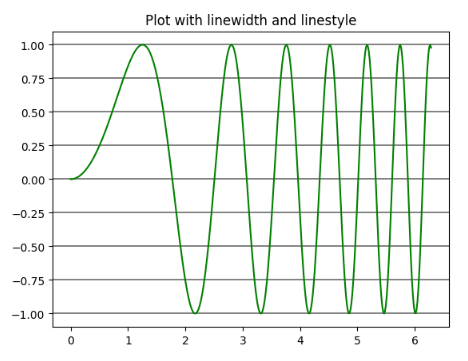
Use axis='y' to enable grid lines only along the y-axis.

Output

👁 g1

Explanation:

  • x = np.linspace(0, 2 * np.pi, 400): Generate 400 points between 0 and 2π.
  • y = np.sin(x ** 2): Compute y = sin(x^2) for each x.
  • plt.grid(True, color="grey", linewidth=1.4, axis='y'): Display horizontal grid lines corresponding to y-axis values.

Related Articles:

Comment
Article Tags: