 |
VOOZH | about |
|
VOOZH | about |
Debugging is a crucial aspect of programming that allows us to track down issues in our code. Setting breakpoints helps in pausing the code execution to inspect the current state, check variable values, and step through our code line by line. In Jupyter Notebooks, debugging can be done interactively using the ipdb library, which is designed for interactive environments like notebooks.
In this article, we’ll explore how to set and use breakpoints in Jupyter Notebook effectively.
Although Python's built-in breakpoint() function (available in Python 3.7 and later) is designed to pause the execution of code for debugging, it may not always work as expected in Jupyter Notebook due to the interactive nature of the environment.
To reliably set breakpoints in Jupyter Notebook, we use the ipdb package, which is specifically designed for interactive debugging in environments like Jupyter. ipdb.set_trace() allows us to pause the execution of our code and enter an interactive debugging session.
Install the ipdb package: If we don’t have the ipdb package installed, we can install it using the following command:
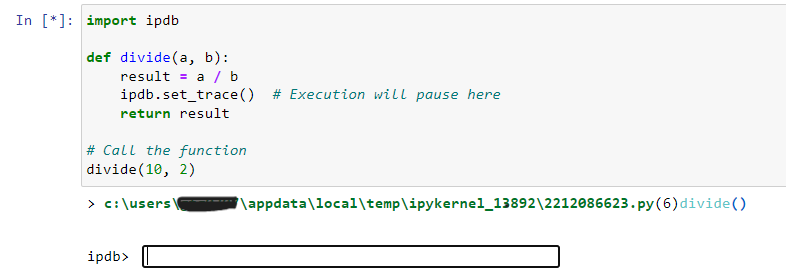
!pip install ipdbSet a Breakpoint with ipdb.set_trace(): After installing ipdb, we can replace breakpoint() with ipdb.set_trace() in our code. When the execution reaches this line, the program will pause, and we can interactively inspect variables and step through our code.
Example:
Output:
In addition to using ipdb.set_trace() to set breakpoints at specific locations in our code, Jupyter Notebooks also provide the %debug magic command. This command allows us to inspect the state of the program after an exception is raised, enabling post-mortem debugging.
Using %debug:
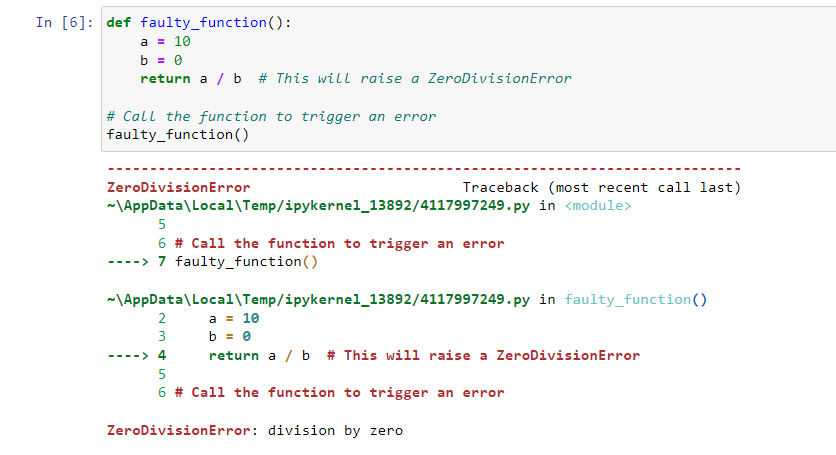
Example:
Output:
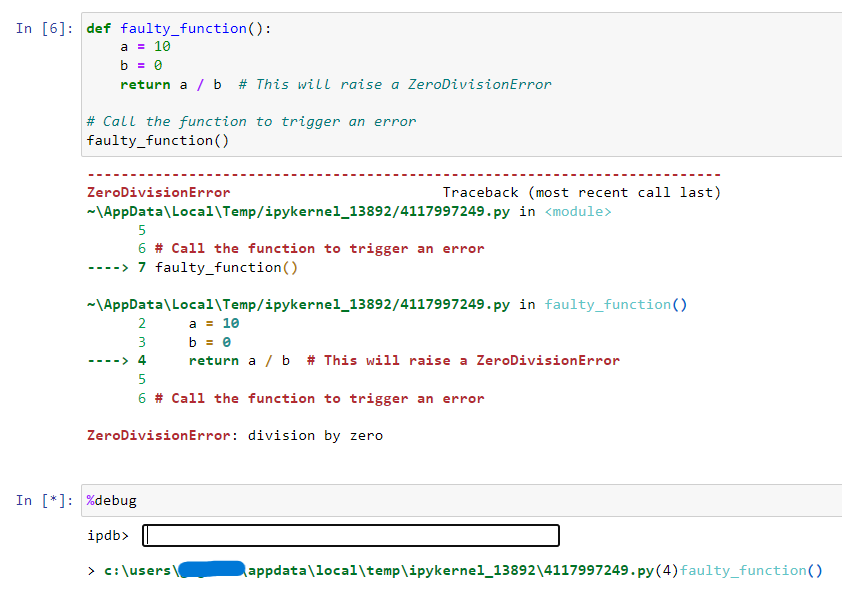
After running this code, a ZeroDivisionError will occur. To enter the debugging session, we would type %debug in the next cell:
Output:
We can then inspect variables like a and b, and step through the execution to understand the cause of the error.
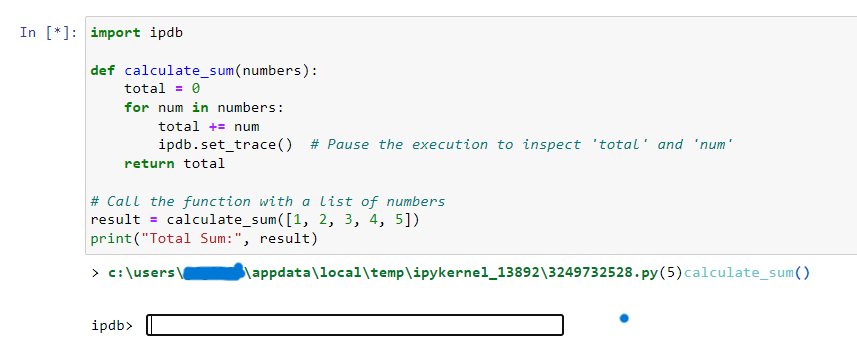
Let’s now walk through a complete example using ipdb to set a breakpoint and inspect the execution of the code interactively.
Example Code:
Output:
Explanation:
Setting breakpoints is a crucial debugging technique, and using ipdb.set_trace() is a reliable way to add breakpoints in Jupyter Notebooks. While Python’s built-in breakpoint() may not always work in Jupyter, ipdb offers interactive debugging capabilities that integrate smoothly with the notebook interface. Additionally, the %debug magic command allows for post-mortem debugging when errors occur. Together, these tools can greatly improve our debugging experience in Jupyter Notebooks.