 |
VOOZH | about |
|
VOOZH | about |
In this article, we will learn how to add a regression line per group with Seaborn in Python. Seaborn has multiple functions to form scatter plots between two quantitative variables. For example, we can use lmplot() function to make the required plot.
A regression line is just one line that most closely fits the info (in terms of getting the littlest overall distance from the road to the points). Statisticians call this system for locating the best-fitting line an easy rectilinear regression analysis using the smallest amount squares method.
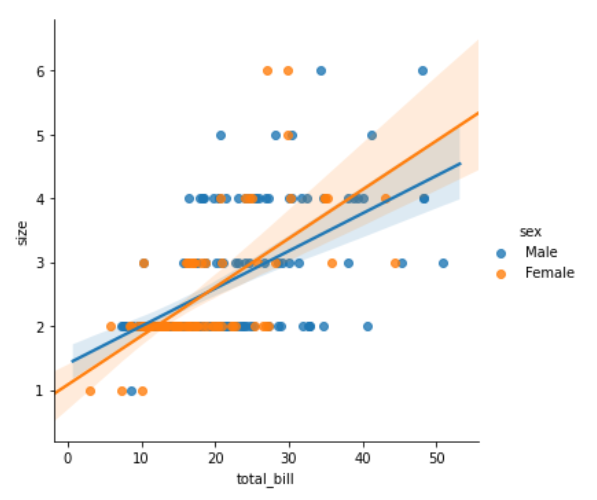
Example 1:
Output:
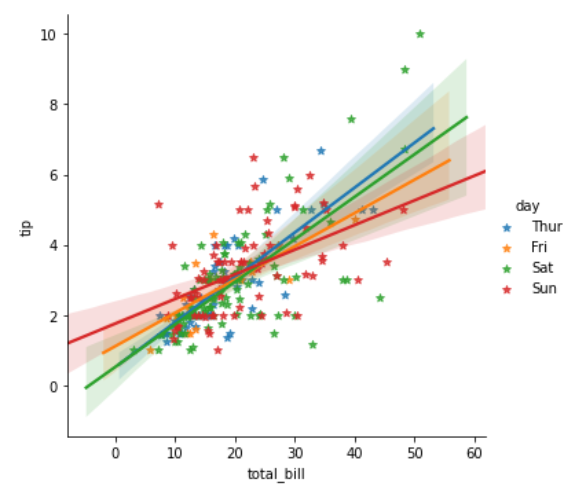
👁 ImageExample 2:
Output:
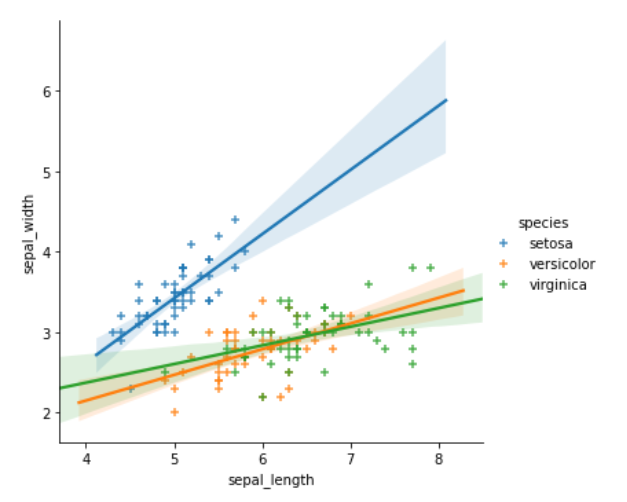
👁 ImageExample 3: