VOOZH about

URL: https://www.geeksforgeeks.org/python/how-to-add-title-to-subplots-in-matplotlib/

⇱ How to Add Title to Subplots in Matplotlib? - GeeksforGeeks


  • Courses
  • Tutorials
  • Interview Prep

How to Add Title to Subplots in Matplotlib?

Last Updated : 26 Nov, 2022

In this article, we will see how to add a title to subplots in Matplotlib? Let's discuss some concepts :

  • Matplotlib : Matplotlib is an amazing visualization library in Python for 2D plots of arrays. Matplotlib is a multi-platform data visualization library built on NumPy arrays and designed to work with the broader SciPy stack. It was introduced by John Hunter in the year 2002.
  • Subplots : The subplots() function in pyplot module of matplotlib library is used to create a figure and a set of subplots. Subplots are required when we want to show two or more plots in same figure.
  • Title of a plot : The title() method in matplotlib module is used to specify title of the visualization depicted and displays the title using various attributes.

Steps Needed

  • Import Libraries
  • Create/ Load data
  • Make subplot
  • Plot subplot
  • Set title to subplots.

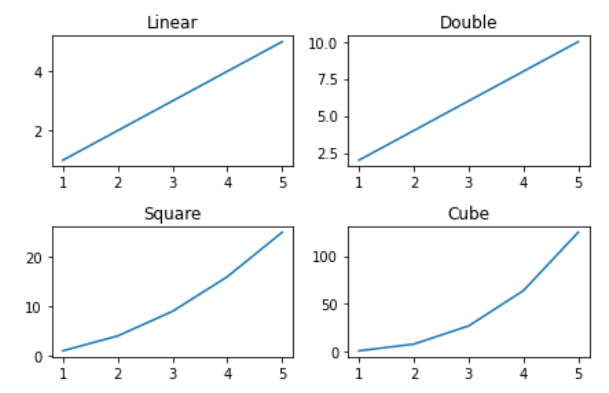
Example 1: (Using set_title() method)

We use matplotlib.axes._axes.Axes.set_title(label) method to set title (string label) for the current subplot Axes.

Output:

👁 Image

Example 2: (Using title.set_text() method)

We can also add title to subplots in Matplotlib using title.set_text() method, in similar way to set_title() method.

Output:

👁 Image

Example 3: (Using plt.gca().set_title() method)

If you use Matlab-like style in the interactive plotting, then you could use plt.gca() to get the reference of the current axes of the subplot and combine set_title() method to set title to the subplots in Matplotlib.

Output :

👁 Image

Example 4: (Using plt.gca().title.set_text() method)

If you use Matlab-like style in the interactive plotting, then you could use plt.gca() to get the reference of the current axes of the subplot and combine title.set_text() method to set title to the subplots in Matplotlib.

Output :

👁 Image

Comment
Article Tags: