 |
VOOZH | about |
|
VOOZH | about |
Prerequisites: pygal
Pygal is a graphics and user interface library for Python that provides functionality commonly required in designing and science applications.
In this article, we will see how we can change chart color in the Pygal module. While making a chart it is important for us to adjust color The following methods are used for the creation of the graph and corresponding color change of the graph. Here we will see some examples to illustrate our point as per our requirement.
Approach:
Implementation of the concept discussed above is given below:
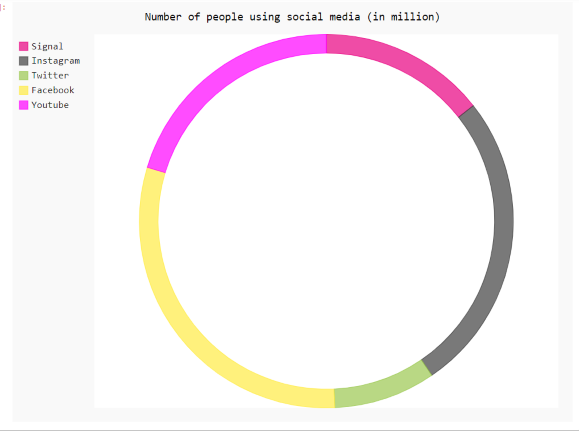
Example 1:
Output
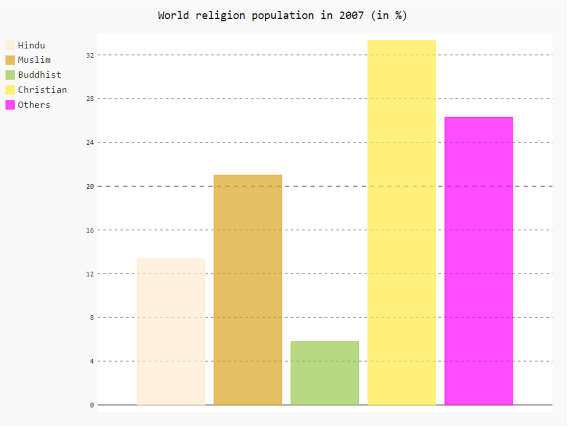
👁 ImageExample 2:
Output
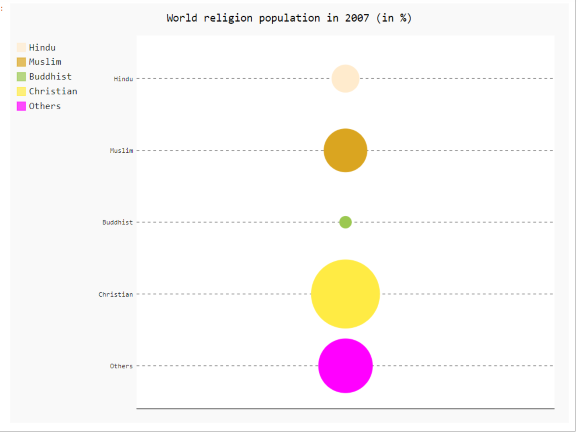
👁 ImageExample 3: