 |
VOOZH | about |
|
VOOZH | about |
Plotly is a Python library that is used to design graphs, especially interactive graphs. It can plot various graphs and charts like histogram, barplot, boxplot, spreadplot, and many more. It is mainly used in data analysis as well as financial analysis. plotly is an interactive visualization library.
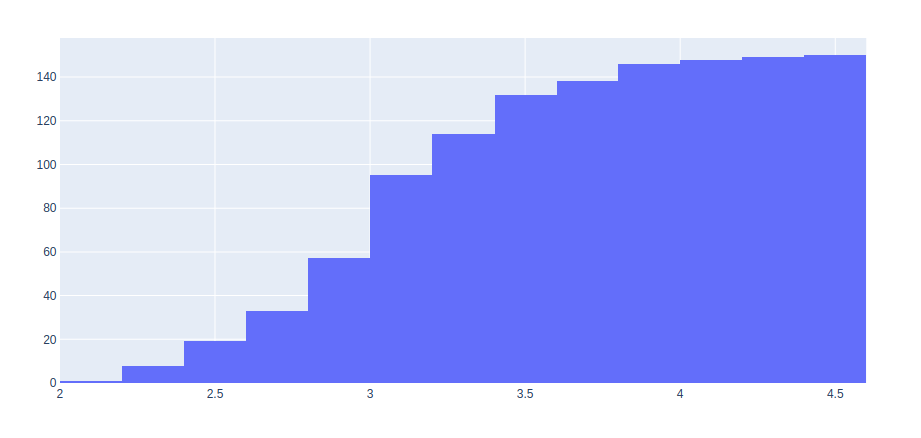
A cumulative histogram is a histogram that counts the cumulative cases over the range of cases. It can be created by passing True to the cumulative_enabled parameter.
Example 1: Vertical cumulative histogram
Output:
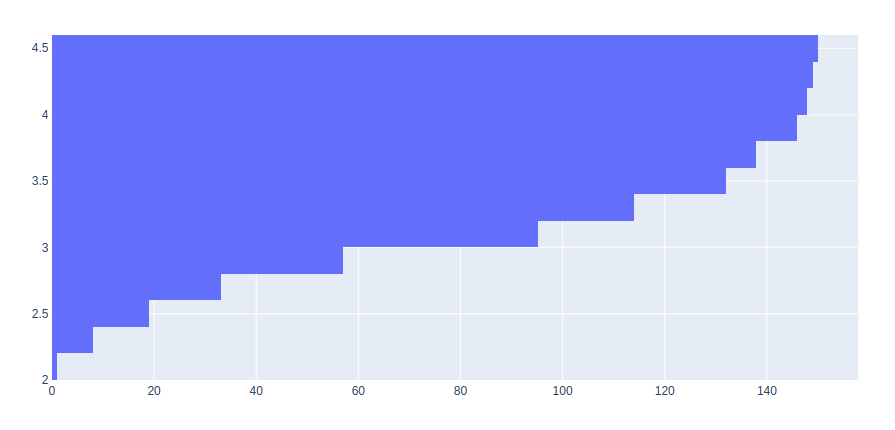
👁 ImageExample 2: Horizontal cumulative histogram