 |
VOOZH | about |
|
VOOZH | about |
The subplot() function in matplotlib helps to create a grid of subplots within a single figure. In a figure, subplots are created and ordered row-wise from the top left. A legend in the Matplotlib library basically describes the graph elements. The legend() can be customized and adjusted anywhere inside or outside the graph by placing it at various positions. Sometimes it is necessary to create a single legend for all subplots.
subplot(nrows,ncols,nsubplot)
For example, subplot(2,1,1) is the figure which represents the first subplot with 2 rows and one column, the first subplot lies in the first row.
The subplot(2,1,2) represents the second subplot which lies in the second row in the first column.
The legend command Syntax:
legend(*args, **kwargs)
If the length of arguments i.e, args is 0 in the legend command then it automatically generates the legend from label properties by calling get_legend_handles_labels() method.
For example, ax.legend() is equivalent to:
handles, labels = ax.get_legend_handles_labels()
ax.legend(handles, labels)
The get_legend_handles_labels() method returns a tuple of two lists, i.e., list of artists and list of labels.
Example 1:
Output:
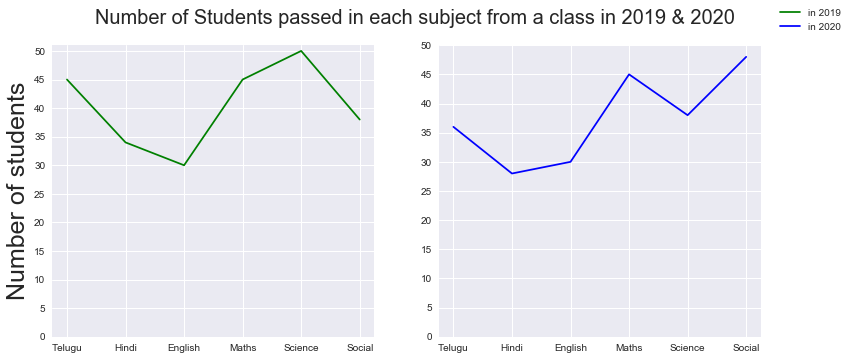
👁 ImageExample 2: Plotting sub-plots of number of students passed in each subject in academic year 2017-20.