 |
VOOZH | about |
|
VOOZH | about |
Debugging is an essential part of the development process, allowing developers to inspect their code, understand its behavior, and identify and fix issues. Visual Studio Code (VSCode) is a powerful, free code editor that offers robust debugging capabilities for Python. This article will guide you through the process of setting up and using VSCode to debug a Python module, from initial setup to advanced debugging techniques.
Debugging is a process in which we identify, analyze, and fix bugs and errors in a Python program. It is a critical process to ensure the proper functioning of the software. To achieve such results we utilize some techniques and tools such as :
Before you can start debugging, you need to ensure that VSCode is properly configured for Python development. This involves installing the necessary extensions and selecting the appropriate Python interpreter.
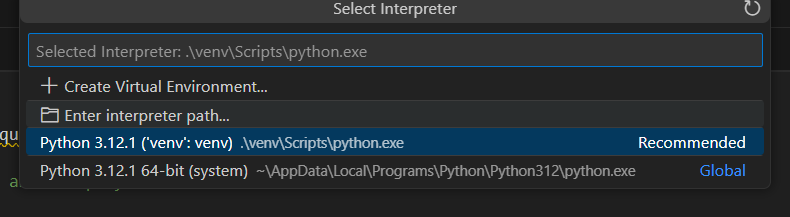
Open the command palette in VS Code (can be accessed by pressing 'ctrl + shift + p' [windows] or 'cmd + Shift + p' [ Mac]) and type " Python: Select Interpreter". Choose the interpreter for python for your virtual environment.
Make sure VS Code can access the Python interpreter without any issues to check just run a basic Python code such as to print hello world to screen.
Open Terminal in VS Code and navigate to your project directory. Create a virtual environment in the project directory by running the following command. This will create a virtual environment with the name 'myvenv'.
python -m venv myenvNow, you can activate the virtual environment using the following command
On Windows:
myenv\Scripts\activateOn MacOS
source myenv/bin/activateTo debug your Python code, you need to set up a debug configuration. This configuration tells VSCode how to run and debug your code.
First, open the Debug view by clicking on the debug icon in the activity bar. Then click on the gear icon to open the 'launch.json' file. If it doesnt exist, VS Code will prompt you to create one. Choose "Python" from the list of options.
Below is a example for the basic configuration file for debugging.
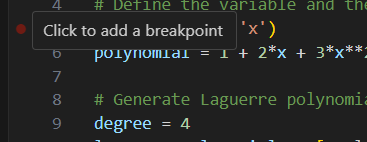
Breakpoints allow you to pause the execution of your code at specific lines, so you can inspect the program state. We can set breakpoints by opening the file that we want to debug. Then, click on the ribbon left of the line numbers, a red dot would appear indicating the Breakpoint.
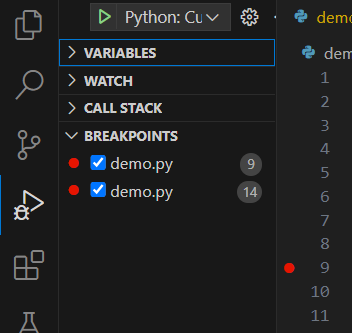
Once the breakpoints are set, you can see the list of all set breakpoints in 'breakpoints' section under Debug view.
We can also edit a breakpoint to add condition to it, such as stopping only when a variable reaches a certain value. This can be done by right clicking the breakpoint added earlier.
With breakpoints set, you can start the debugging process and step through your code to identify issues.
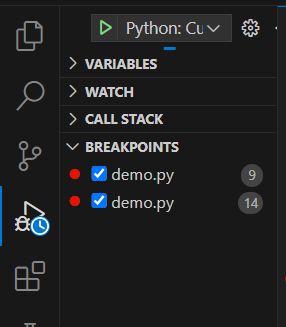
In the Debug view make sure your configuration (e.g.:"Python: Current File") is selected. Click the Green play button (Start Debugging) or press 'F5'. Once you start debugging process, you can see a small clock icon appearing in the debug view.
We can use the toolbar to control execution:
VSCode provides tools to inspect the state of your variables and evaluate expressions while debugging.
This area, view and inspect the values of the local and the global variables. It shows the variable with their current values at the point of execution. While debug mode, hover your mouse pointer over the variables in the code to assess their current state in a tooltip.
In the debug view, under the watch section u can add variable and expression to monitor their values throughout the execution. Click '+' to add the variable or expression.
You can view the current call stack to understand the sequence of the function calls leading to the current state of execution.
This console allows us to execute Python commands to debug the required python code. You can use it to evaluate expressions, modify variables and call functions.
VSCode offers advanced debugging features, such as exception breakpoints, logpoints, multi-threaded debugging, and remote debugging.
To edit a breakpoint just right click on the breakpoint and select edit breakpoint. You can then add conditions like "x==5" which only breaks when the condition is true.
Set breakpoints on exceptions to pause execution when specific exceptions are thrown. Click the gear icon in the Breakpoints pane and select "Add Exception Breakpoint.
In the break panel, click the '+' sign to add a function to a breakpoint by entering its name which breaks when the function is called.
They are similar to breakpoints but instead of breaking they log a message to the console. to add them right click on the ribbon left of the line number and select "add Logpoint".
Configure launch.json for remote debugging to connect to a remote Python interpreter, useful for debugging code running on another machine or in a container.
Debugging Python code in VSCode is a powerful way to understand and fix issues in your code. By following the steps you can effectively setup and start you debugging journey in Python.