 |
VOOZH | about |
|
VOOZH | about |
In this article we will see how to display bar charts in dataframe on specified columns. For doing this task we are using DataFrame.style.bar() method of Pandas Dataframe.
Syntax: pandas.DataFrame.style.bar(columns_list, color)
Return: Dataframe with the given color bar strips on the positive definite values. The None value and the negative values are skipped in the process.
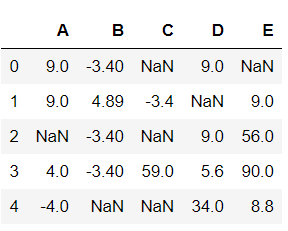
Now, Let's create a Dataframe:
Output:
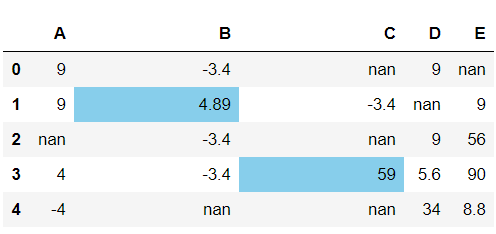
👁 ImageExample 1:
Output:
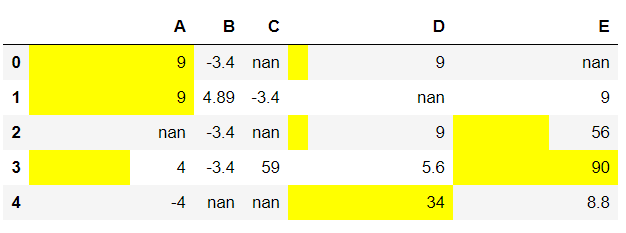
👁 ImageExample 2: