 |
VOOZH | about |
|
VOOZH | about |
Scatter plots are a powerful visualization tool that helps in identifying relationships between two quantitative variables. In Python, libraries like Matplotlib and Seaborn provide excellent functionalities for creating scatter plots with various customizations. One common customization is to create scatter plots with empty circles. This article will guide us through the steps to create a scatter plot with empty circles using Matplotlib and Seaborn.
Empty circles in scatter plots represent points in a dataset without any fill color. They are often used to highlight the presence of data points without obscuring overlapping points, making it easier to visualize distributions and clusters. Empty circles can also be useful for distinguishing between different groups of data.
Before we start creating scatter plots, ensure we have the following libraries installed:
pip install matplotlib seaborn numpy pandasNow we will discuss step-by-step implementation of How to Do a Scatter Plot with Empty Circles in Python.
First, we need to import the necessary libraries:
We can either use our dataset or create a sample dataset for demonstration. Here, we’ll generate some random data:
Now, we can create a scatter plot with empty circles using the scatter function:
Output:
facecolors='none': This parameter makes the circles empty (no fill color).edgecolors='blue': This parameter sets the color of the circle's edges to blue.s=100: This parameter sets the size of the circles.We should see a scatter plot where all points are represented by empty blue circles.
Seaborn, built on top of Matplotlib, provides a more aesthetically pleasing way to create visualizations with less code. To create a scatter plot with empty circles using Seaborn, follow these steps:
Make sure to import Seaborn along with the other libraries:
We can create a DataFrame to hold our data:
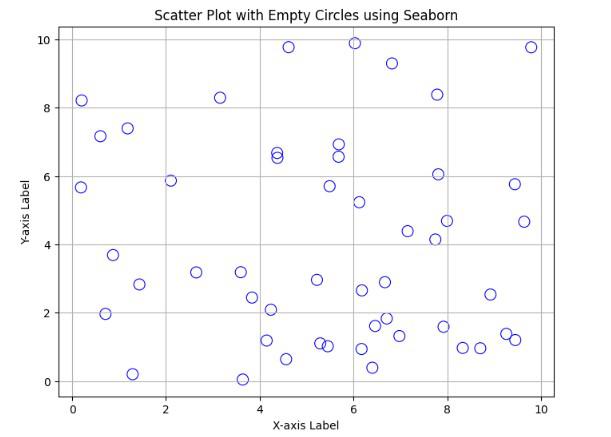
Use Seaborn’s scatterplot function to create the plot:
Output:
edgecolor='blue': This sets the color of the edges of the circles.facecolor='none': This makes the circles empty.s=100: This sets the size of the circles.We should see a scatter plot similar to the one created with Matplotlib, but with Seaborn's styling applied.
Creating scatter plots with empty circles in Python can enhance the clarity of our visualizations, especially when dealing with overlapping data points. Both Matplotlib and Seaborn provide easy methods to achieve this customization, allowing us to create visually appealing and informative plots.