 |
VOOZH | about |
|
VOOZH | about |
Prerequisites: Altair
Simple Histogram is the representation of frequency distribution by means of rectangles whose width represents the class interval. Histogram is the graphical representation that organizes grouped data points into the specified range. By using histogram we can visualize large amount of data and it's frequency as one contiguous plot.
Installation:
For installing the altair library and vega_datasets we have the run the following command in our command prompt.
pip install altair
pip install vega-datasets
In this article we are going to plot Simple histogram with the help of altair library by using cars and iris datasets in the below various examples.
Step-by-step Approach:
Syntax:
altair.Chart(name_of_dataset).mark_bar().encode(x ="name_of_col1", y="name_of_col2")
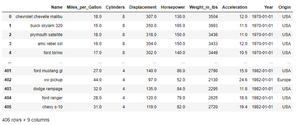
Example 1: Printing the dataset of cars()
Output:
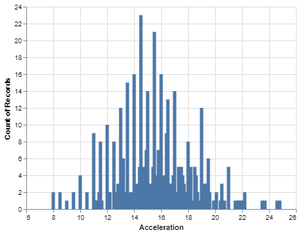
👁 ImageExample 2: Making the default Simple Histogram using the cars dataset.
Output:
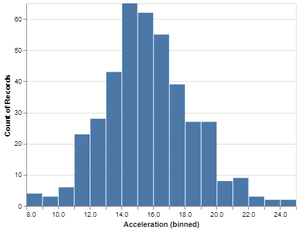
👁 ImageExample 3: Making the Simple Histogram using the cars dataset by setting the bin on Acceleration.
Output:
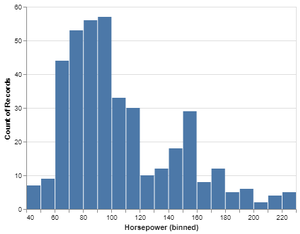
👁 ImageExample 4: Making the Simple Histogram using the cars dataset by setting the bin on Horsepower.
Output:
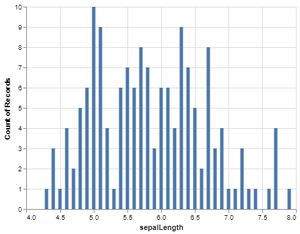
👁 ImageExample 5: Making the default Simple Histogram using iris dataset on sepalLength.
Output:
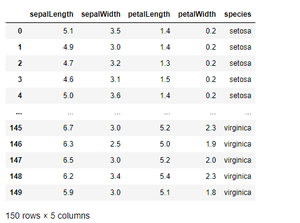
👁 ImageWe can also print the iris dataset using print(iris_data) in the program after loading the iris dataset. Our iris dataset after printing it looks like this.
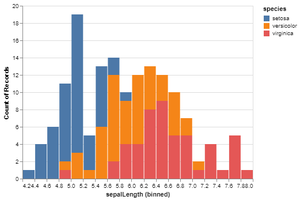
👁 ImageExample 6: Making the Simple Histogram by setting bin and color.
Output:
👁 ImageIn the same way we can make the simple histogram on any values of dataset and can set the color accordingly.
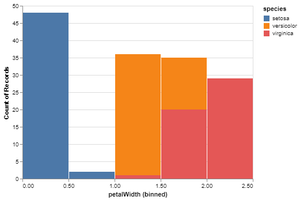
Example 7: Making Simple Histogram using iris dataset on petal width by setting bin and color.