 |
VOOZH | about |
|
VOOZH | about |
Seaborn is a Python data visualization library based on matplotlib. It provides a high-level interface for drawing attractive and informative statistical graphics. Basically, it helps us stylize our basic plot made using matplotlib. Moreover, it also provides us different plotting techniques to ease our Exploratory Data Analysis(EDA). With these plots, it also becomes important to provide legends for a particular plot.
In this following article, we are going to see how can we place our Legend on our plot, and later in this article, we will also see how can we place the legend outside the plot using Seaborn.
We will start by importing our necessary libraries.
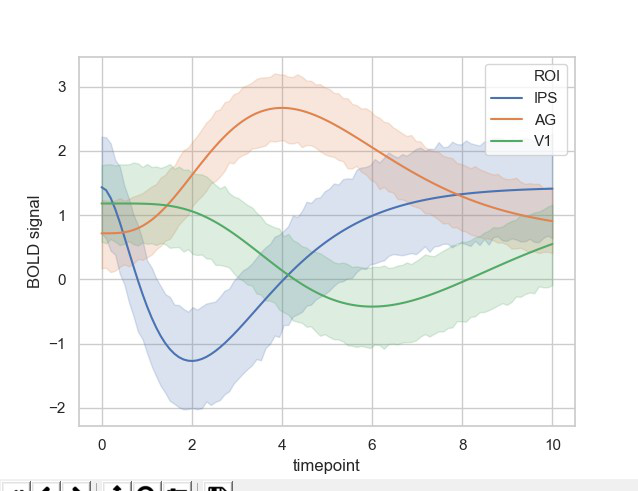
We will be using Seaborn for not only plotting the data but also importing our dataset. Here we will be using the Gamma dataset by seaborn.
Output:
👁 ImageWe can see that this plots a beautiful line plot graph with the legends. We can see that the legend box is on the plot. This might be an issue in many plots, so we need to keep our legend box outside the plot.
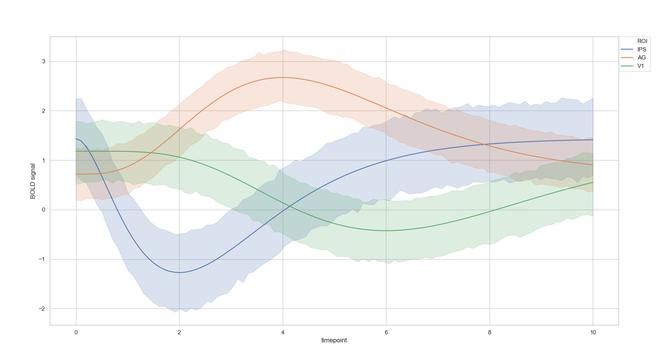
We can do this by using matplotlib's legend function and providing its necessary parameters.
Output:
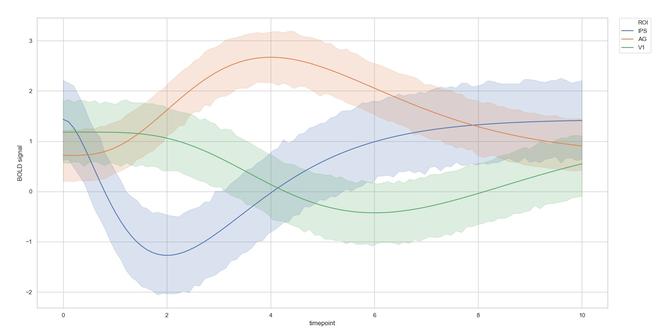
👁 ImageWe can also tune our parameters according to our necessities.
Output:
👁 ImageHence, this technique can be used in many scenarios where the legend box comes on the graph which may be otherwise useful for our EDA.