 |
VOOZH | about |
|
VOOZH | about |
In this article, we are going to see how to set the title and fonts in seaborn chart. Data Visualization is the presentation of data in pictorial format. It is extremely important for Data Analysis, primarily because of the fantastic ecosystem of data-centric Python packages and seaborn is an amazing visualization library for statistical graphics plotting in Python.
Installation:
For python environment :
pip install seaborn
For conda environment :
conda install seaborn
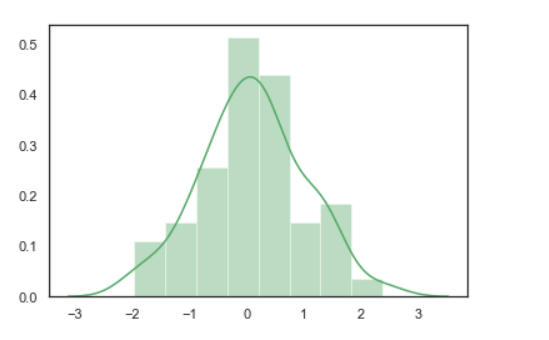
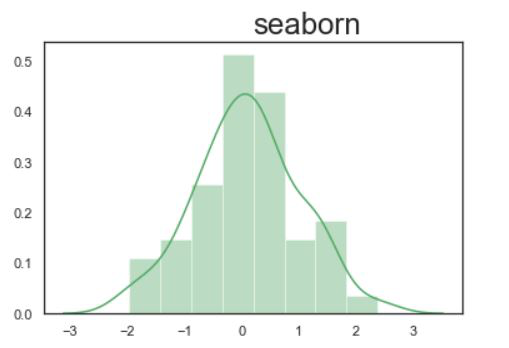
Output:
👁 ImageNow we can add a title using set_title() function. This function is capable of a set title and font styling.
Syntax: Axes.set_title(label, fontdict)
Parameters:
- label: String
- fontdict: A dictionary controlling the appearance of the title text.
Example 1: Adding title in the seaborn chart.
In this example, we are going to set the title using set_title() function.
Syntax: set_title("Label")
Code:
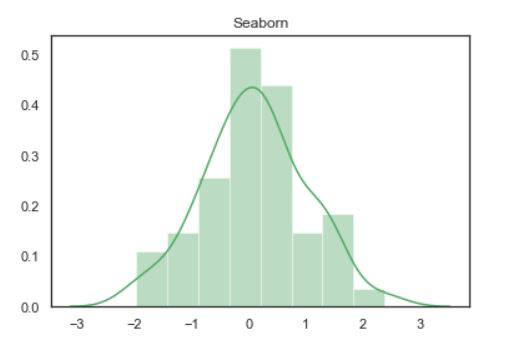
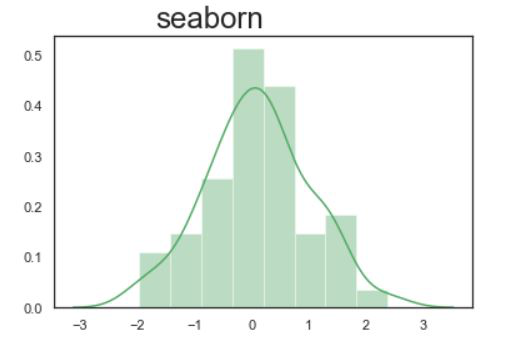
Output:
👁 ImageExample 2: Increase font size of the title.
Here we are increasing the size of the font using fontsize attributes.
Syntax: set_title("Label", fontdict={ 'fontsize : int'})
Code:
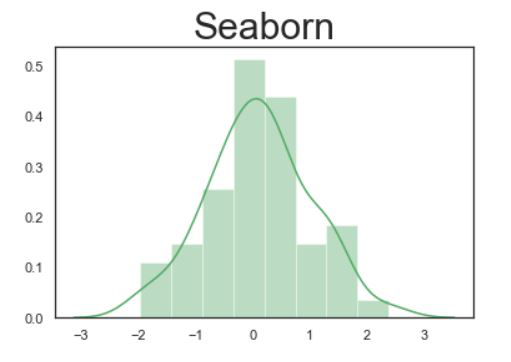
Output:
👁 ImageExample 3: Setting vertical alignment of a font.
Here we are setting alignment of a font using verticalalignment attributes. Valid verticalalignment value for align; supported values are 'top', 'bottom', 'center', 'baseline', 'center_baseline'.
Syntax: set_title("Label", fontdict={ 'fontsize : int', verticalalignment ="'top', 'bottom', 'center', 'baseline', 'center_baseline'"})
Code:
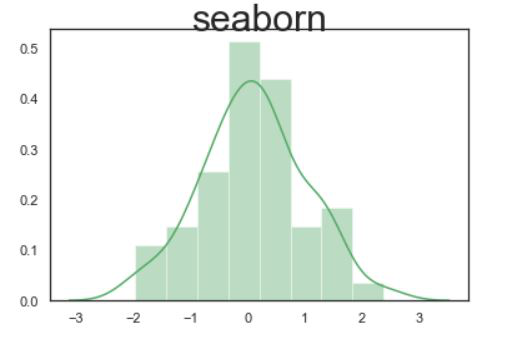
Output:
👁 ImageExample 4: Setting horizontal alignment.
Here we are setting the alignment of a font using horizontalalignment attributes. Valid horizontalalignment value for align; supported values are center', 'right', 'left'.
Syntax: set_title("Label", fontdict={ 'fontsize : int', horizontalalignment ="'center', 'right', 'left'"})
Code:
Output:
👁 ImageNow check for right side alignment using horizontalalignment': 'right':