A
line chart or
line graph is a type of chart which helps to displays the information as a series of all data points called ‘markers’ and those markers are connected straight through line segments. It is a basic type of chart common in many fields which shows ascending or descending in a graph. A line chart is often used to visualize a trend in data over intervals of time which helps to represent the graph more effectively. Dimensions in the data are often displayed on the x-axis and y-axis.
Creating Line Chart
1) Simple Line Chart: Simple basic line graphs are used for showing the relationship between two variables in vertical form. Line() method is used to create simple line graphs in Pygal.
Syntax:
line_chart = pygal.Line()
Example:
Output:
👁 Image
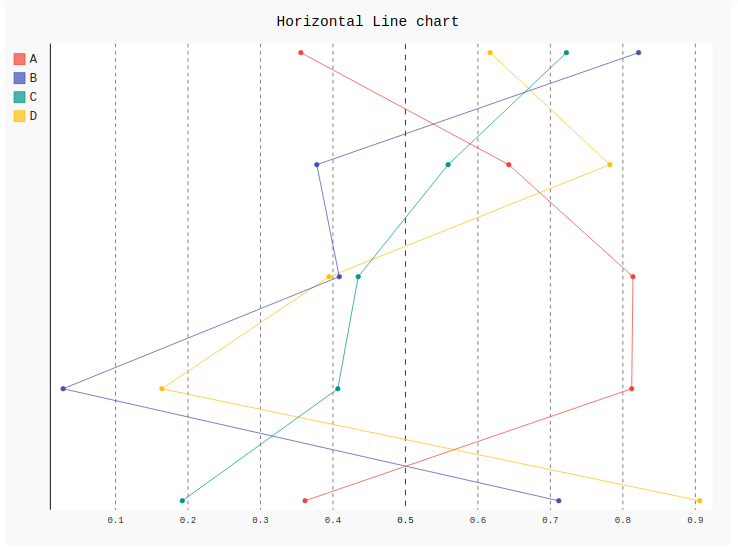
2) Horizontal line chart: Horizontal line graph is the same as a basic line graph but the difference is it shows line horizontally from x-axis to y-axis. Both the variables are shown horizontally.
Syntax:
line_chart = pygal.HorizontalLine()
Example:
