 |
VOOZH | about |
|
VOOZH | about |
The markers module in Matplotlib helps highlight individual data points on plots, improving readability and aesthetics. With various marker styles, users can customize plots to distinguish data series and emphasize key points, enhancing the effectiveness of visualizations.
To illustrate this concept, consider the following simple example where we plot a line graph with circular markers:
Output:
In this example, each point on the line is marked with a circle ('o'), making it easy to identify individual data points.
The Matplotlib.markers module provides functions to handle markers in Matplotlib. Each marker has a specific character or symbol associated with it that represents how the data point will appear on the graph. This flexibility allows users to customize their plots according to their preferences or requirements
Below is the table defining most commonly used markers in Matplotlib:
| Marker | Symbol | Description |
|---|---|---|
| "." | • | point |
| "o" | ⬤ | circle |
| "v" | ▼ | triangle_down |
| "^" | ▲ | triangle_up |
| "s" | ■ | square |
| "p" | ⬟ | pentagon |
| "*" | ★ | star |
| "8" | ⬢ | octagon |
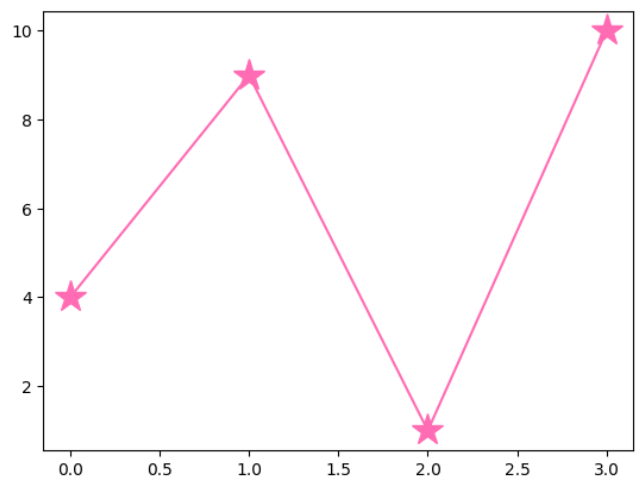
Let's mark each point by star symbol:
Output:
This code generates a plot showcasing different Matplotlib markers. It iterates through a list of marker styles and displays them on the same x-axis, with each marker positioned along a horizontal line at different y-values.
Output:
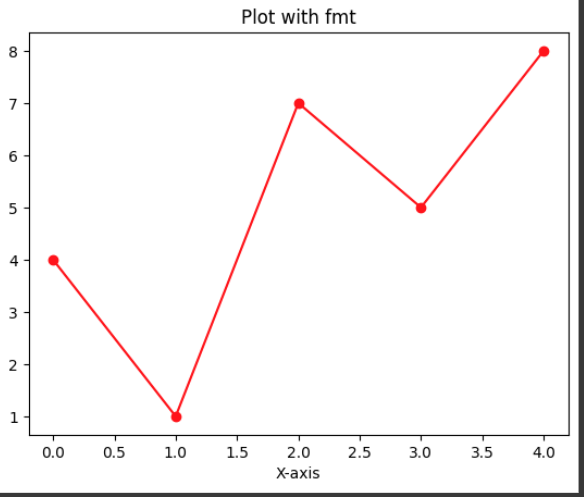
The syntax for using the fmt parameter in Matplotlib is actually a combination of marker, line style, and color, where the format string follows this structure:
Syntax: fmt = 'marker|line|color'
- Marker: Specifies the style of the points, e.g.,
'o'for circles,'s'for squares, etc.- Line: Specifies the style of the line, e.g.,
'-'for a solid line,':'for a dotted line, etc.- Color: Specifies the color of the plot elements, e.g.,
'r'for red,'b'for blue, etc.
Let's have a look at the example:
Output:
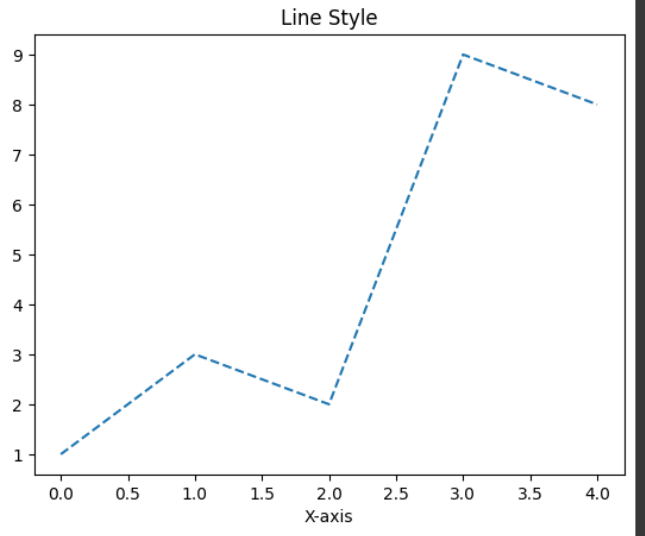
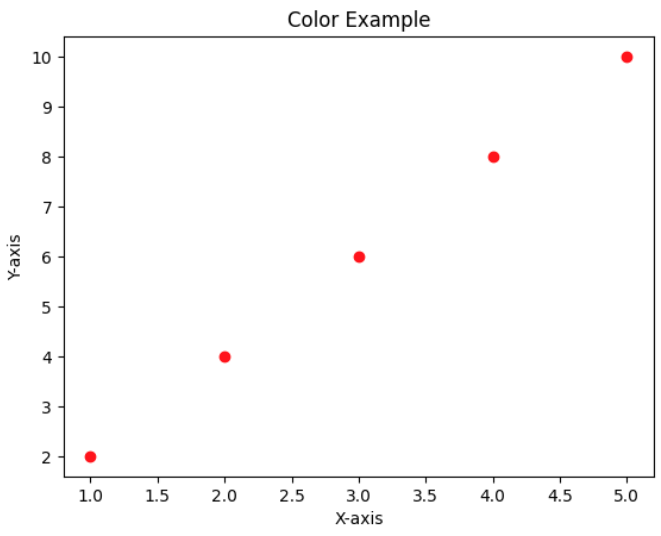
The line and color reference in Matplotlib allows you to customise the appearance of plot lines and markers. You can quickly set the line style and color to enhance visual clarity and aesthetics.
Line Style | Symbol |
|---|---|
Solid line | '-' |
Dashed line | '┈' |
Dash-dot line | '-.' |
Dotted line | ':' |
Long dashed line | '--' |
Custom dash | 'dotted' |
Output:
Color | Symbol |
|---|---|
Red | 'r' |
Green | 'g' |
Blue | 'b' |
Cyan | 'c' |
Magenta | 'm' |
Black | 'k' |
Yellow | 'y' |
Orange | 'orange' |
Purple | 'purple' |
White | 'w' |
Output:
You can use the keyword argument markersize or the shorter version, ms to set the size of the markers:
Output: