 |
VOOZH | about |
|
VOOZH | about |
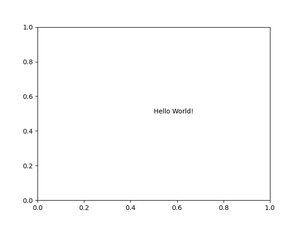
matplotlib.pyplot.text() function in Python is used to add text to the axes at a specific location (x, y) in data coordinates. It is commonly used to annotate plots with labels, notes or mathematical equations.
Syntax:
matplotlib.pyplot.text(x, y, s, fontdict=None, **kwargs)
Parameters:
| Parameter | Description |
| x, y:float | The position to place the text. By default, this is in data coordinates. The coordinate system can be changed using the transform parameter. |
| s :str | The text. |
| fontdict : dict default none | A dictionary to override the default text properties. If fontdict is None, the defaults are determined by rcParams. |
| **kwargs | Text properties. |
Output:
👁 ImageExplanation:
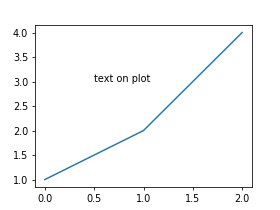
Output:
👁 ImageExplanation: