 |
VOOZH | about |
|
VOOZH | about |
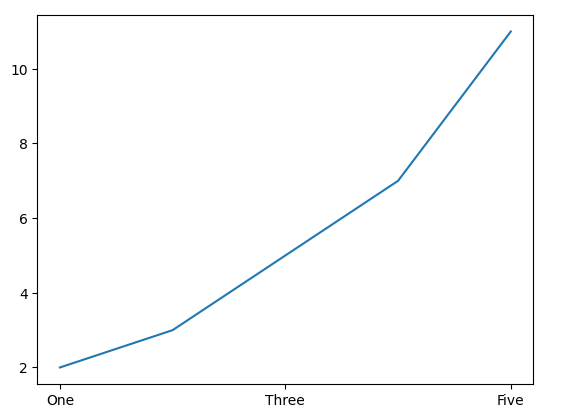
matplotlib.pyplot.xticks() function is used to get or set the x-axis ticks in a plot. This function allows you to modify the labels and positions of the ticks along the x-axis, providing greater flexibility and control over your plots. Let's see an example to better understand this.
Example: Set Custom Tick Positions and Labels
Output:
Explanation:
matplotlib.pyplot.xticks(ticks=None, labels=None, **kwargs)
Parameters:
Return Value:
The function returns the current x-axis tick positions and labels.
1. Customizing X-axis Tick Labels with Rotation and Adjusting Margins
Output:
👁 ImageExplanation: This code creates a plot with custom x-axis labels (Geeks1, Geeks2, etc.), rotates them vertically, and adjusts margins to avoid clipping of tick labels. plt.subplots_adjust() ensures the labels fit within the plot.
2. Using Matplotlib.pyplot.xticks() with Zoomed-In Inset Plot
Output:
👁 ImageExplanation: This code creates a main plot with a zoomed-in inset using zoomed_inset_axes. The get_demo_image() function loads a sample 15x15 data array, which is displayed in both the main plot and the inset. The inset plot zooms in on a specific portion of the main plot.