When discussing Python performance, many developers primarily think about execution time “how fast does the code run?”. However, in real-world applications, memory usage is equally important. If a program consumes excessive RAM, it may slow down entire system or even lead to crashes.
This is where memory profiling becomes valuable. It helps track how much memory different parts of code are consuming. In this article, Python package memory-profiler will be used to analyze memory usage of functions step by step.
Step by Step Implementation
Step 1: Install Required Packages
We’ll need to install:
memory-profiler: To track memory usage
requests: To test memory profiling on a large text file
Run following command on cmd:
pip install memory-profiler requests
Step 2: Profiling Code
Now that everything is set up, create a file with name word_extractor.py and add below code to it.
Explanation:
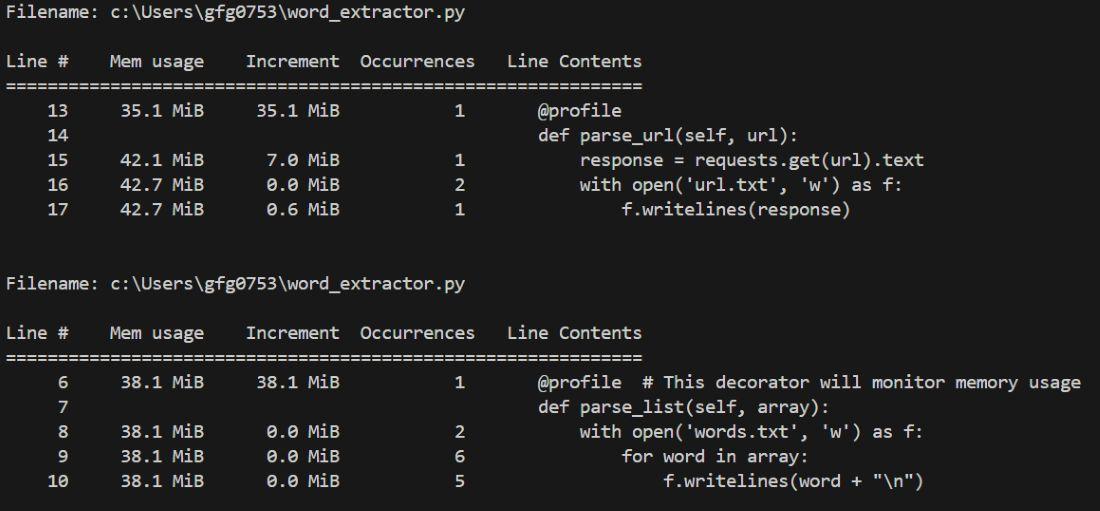
@profile decorator tells Python to monitor memory usage of that function.
parse_list(): Writes words from a list to a file.
parse_url(): Downloads a huge word list from a URL and saves it to a file (this will consume much more memory).
Step 3: Driver Code
Now, our main code is ready. Let's write driver code which will call this class functions. Now, create another file called run.py and write following code in it.
Explanation:
extractor = BaseExtractor(): Creates an object of the BaseExtractor class.
extractor.parse_url(url): Extracts and processes words from given URL (large dataset, uses more memory).
extractor.parse_list(array): Extracts and processes words from small local list (uses less memory).
Step 4: Run the Profiler
Now to test the code, simply run run.py file. Run following command:
python -m memory_profiler run.py
If everything ran successfully, then you should see something like this:
