 |
VOOZH | about |
|
VOOZH | about |
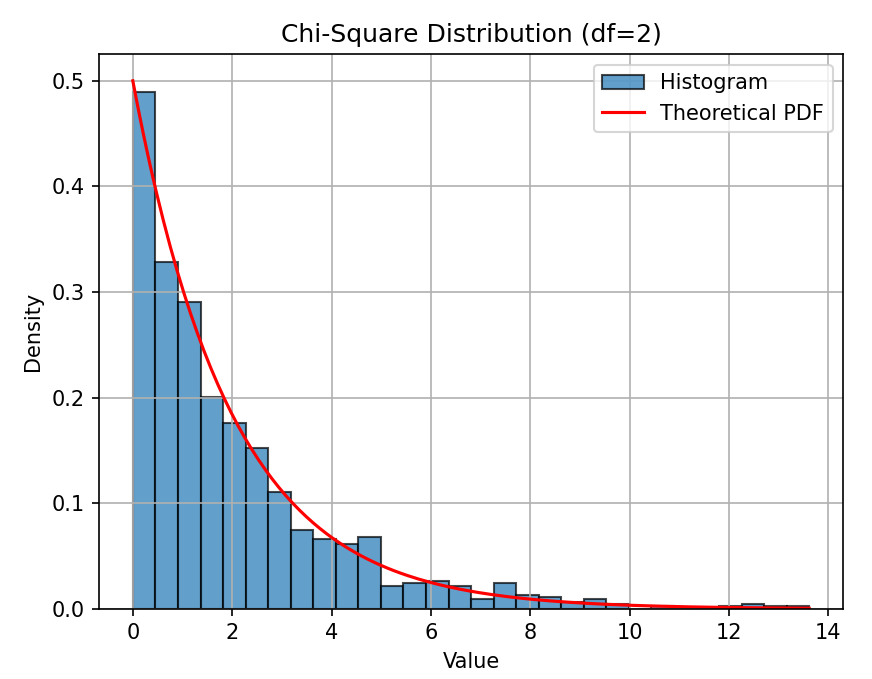
The Chi-Square Distribution appears when you add up the squares of independent standard normal random variables. It is widely used in hypothesis testing, goodness-of-fit tests, variance testing, and statistical modeling. In NumPy, we generate Chi-Square values using numpy.random.chisquare().
Example: Here, we generate one Chi-Square random value using df = 2 (degrees of freedom).
0.3396810372458067
Explanation: np.random.chisquare(df=2) generates one value formed by summing the squares of 2 standard normal variables.
numpy.random.chisquare(df, size=None)
Parameters:
Example 1: In this example, we generate 5 Chi-Square random values with df = 2.
[0.9664276 0.9718178 0.05315296 5.76413224 0.17793754]
Explanation: np.random.chisquare(..., size=5) returns an array of 5 simulated Chi-Square outcomes.
Example 2: Here, we generate Chi-Square values with a higher degree of freedom (df = 5).
[5.5554776 8.39987081 1.96062558 1.15995049]
Explanation: np.random.chisquare(5) produces values based on 5 summed squares, giving a wider and more symmetric shape.
Example 3: In this example, we generate a 2×3 matrix of Chi-Square random values.
[[0.04478657 4.99709829 0.51742473]
 [0.87978466 1.96904351 3.51846182]]
Explanation: size=(2,3) creates a matrix where each element is a Chi-Square-distributed value.
Visualizing the generated numbers helps in understanding how the Chi-Square curve behaves for different degrees of freedom.
Output
Explanation: