 |
VOOZH | about |
|
VOOZH | about |
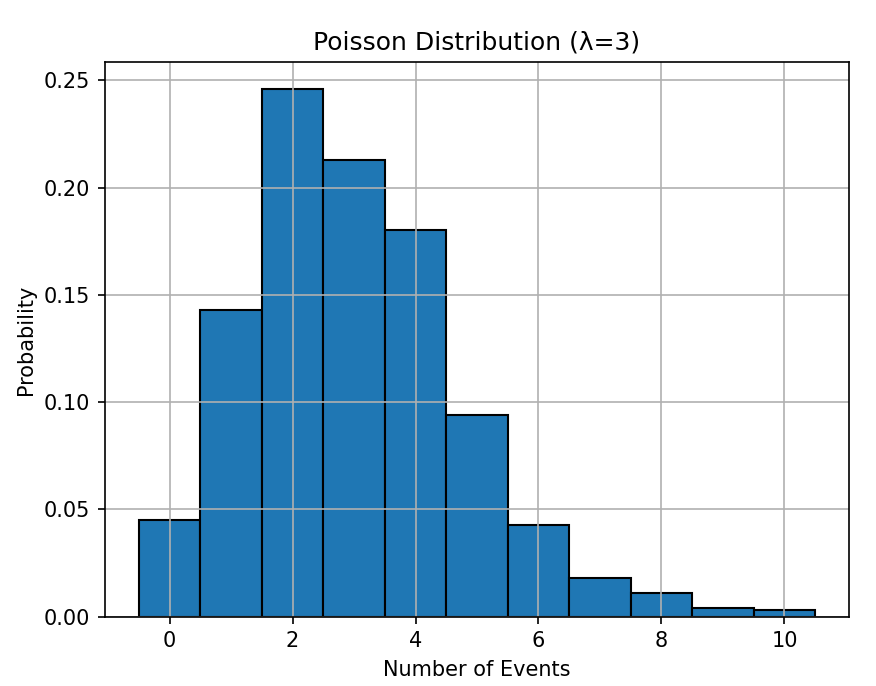
The Poisson Distribution models how many times an event occurs within a fixed interval when the average occurrence rate (λ) is known. It is commonly used for scenarios like customer arrivals, call center traffic, website visits, or any event that happens independently over time or space.
In NumPy, we use the numpy.random.poisson() method to generate Poisson-distributed random values.
Example: In this example, we generate a basic Poisson-distributed number using the default parameters to understand how the function works.
5
Explanation: np.random.poisson(lam=3) generates numbers around λ = 3, which is the expected average event count.
numpy.random.poisson(lam=1.0, size=None)
Parameters:
Example 1: In this example, we generate one random number with an expected average of λ = 5.
5
Explanation: np.random.poisson(lam=5) returns a number whose expected average value is 5.
Example 2: Here, we generate five Poisson-distributed numbers using λ = 5.
[4 9 4 5 3]
Explanation: size=5 creates a 1D array of 5 Poisson values generated using λ = 5.
Example 3: In this example, we generate a 2×3 array of Poisson values using λ = 4.
[[6 6 3]
 [6 2 8]]
Explanation: size=(2, 3) tells NumPy to generate a 2×3 matrix filled with Poisson-distributed values.
To understand the distribution better we can visualize the generated numbers. Here is an example of plotting a histogram of random numbers generated using numpy.random.poisson.
Output
Explanation: