 |
VOOZH | about |
|
VOOZH | about |
Pandas is a very vast library that offers many functions with the help of which we can understand our data. Pandas profiling provides a solution to this by generating comprehensive reports for datasets that have numerous features. These reports can be customized according to specific requirements. In this article, we will dive into this library's functionalities and explore its various features like:
Pandas Profiling can be easily installed using the following command
pip install pandas-profiling
The pandas_profiling library in Python includes a method named as ProfileReport() which generates a basic report on the input DataFrame.
The report consists of the following:
Syntax :
pandas_profiling.ProfileReport(df, **kwargs)
Arguments | Type | Description |
|---|---|---|
df | DataFrame | Data to be analyzed |
bins | int | Number of bins in histogram. The default is 10. |
check_correlation | boolean | Whether or not to check correlation. It's `True` by default. |
correlation_threshold | float | Threshold to determine if the variable pair is correlated. The default is 0.9. |
correlation_overrides | list | Variable names not to be rejected because they are correlated. There is no variable in the list (`None`) by default. |
check_recoded | boolean | Whether or not to check recoded correlation (memory heavy feature). Since it's an expensive computation it can be activated for small datasets. `check_correlation` must be true to disable this check. It's `False` by default. |
pool_size | int | Number of workers in thread pool. The default is equal to the number of CPU. |
Now, let's take an example, we will create our own data frame and will have a look at how pandas profiling can help in understanding the dataset more. Before that let us import the pandas_profiling.
Now, create the data frame or import any dataset.
Output:
 ID Name Marks Grade
0 23 Ram 89 B
1 43 Deep 97 A
2 12 Yash 45 F
3 13 Aman 78 C
4 67 Arjun 56 E
5 89 Aditya 76 C
6 90 Divya 100 A
7 56 Chalsea 87 B
8 34 Akash 81 B
For generating the profile report we will simply use the Profile Report from pandas_profile and input will the dataframe.
Overview consists of 3 tabs, these are Overview, Alerts, and Reproduction.
The Overview consists of dataset statistics and variable types. Dataset statistics gives us information on number of variables, duplicates and missing values.
Next is the Alerts tab, which gives us information on the correlated variables. Also, about the unique values. Here, the data is small but if the dataset will be large then it will also tell us about missing values, skewness of data, etc.
The Reproduction tab tells us about the start and end time of the report generation, also about the duration, software version, etc. Take a look at the below image for more clearance.
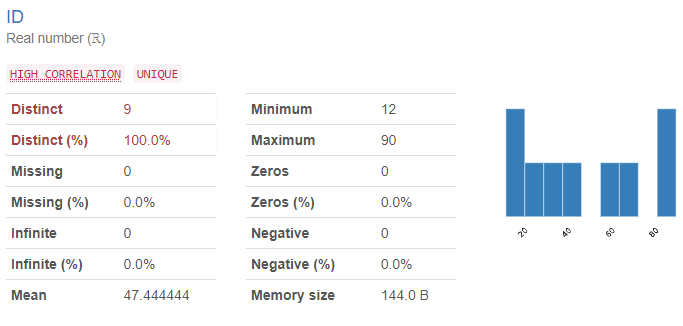
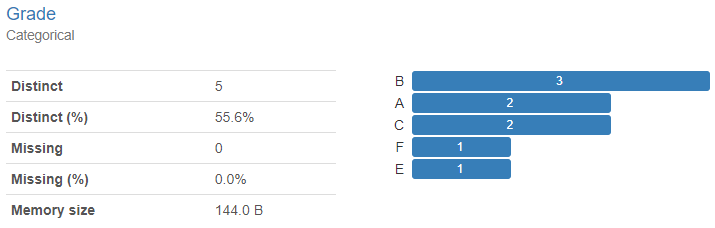
This section gives us information on the variables, which tells us about the type of the variable, then distinct and missing values with the memory size that the variable is taking. Let's see the example of two variables below, id is a real number and grade is categorical.
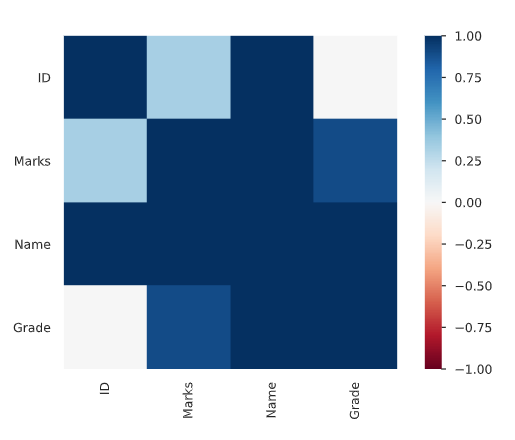
A statistical tool that helps in the study of the relationship between two variables is known as Correlation.
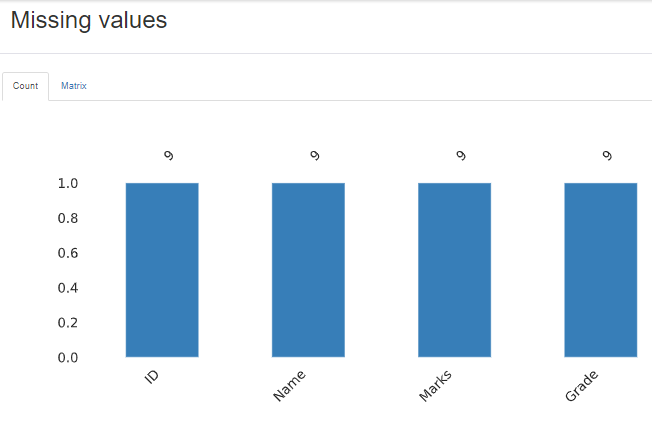
The profile report also gives us information on missing values in the data visually using the bar plot.
This displays the first and last 10 rows of the dataset.
We can save the report in either HTML or JSON format. The code for that is shown below:
.png)
.png)