 |
VOOZH | about |
|
VOOZH | about |
Plotly library of Python can be very useful for data visualization and understanding the data simply and easily. Plotly graph objects are a high-level interface to plotly which are easy to use.
This method is used to create a ternary line plot. A ternary line plot is used to depicts the ratio of three variables on an equilateral triangle.
Syntax: plotly.express.line_ternary(data_frame=None, a=None, b=None, c=None, color=None, line_dash=None, line_group=None, hover_name=None, hover_data=None, title=None, template=None, width=None, height=None)
Parameters:
data_frame: DataFrame or array-like or dict needs to be passed for column names.
a, b, c: These parameters are either a name of a column in data_frame, or a pandas Series or array_like object. These are used to position marks along the a, b, and c axis in ternary coordinates respectively.
color: This parameters assign color to marks.
hover_name: Values from this column or array_like appear in bold in the hover tooltip.
hover_data: This parameter is used to appear in the hover tooltip or tuples with a bool or formatting string as first element, and list-like data to appear in hover as second element Values from these columns appear as extra data in the hover tooltip.
title: The title of the figure.
width: Set the width of the figure.
height: Set the height of the figure.
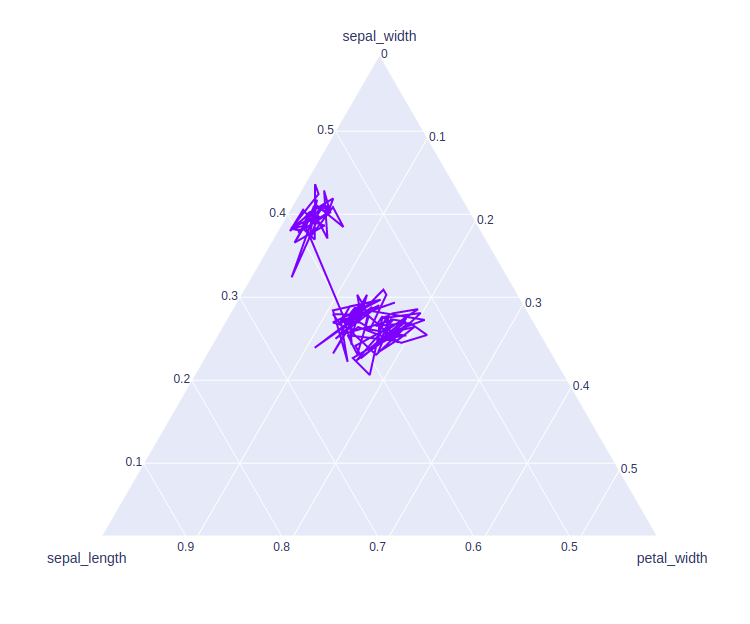
Example 1:
Output:
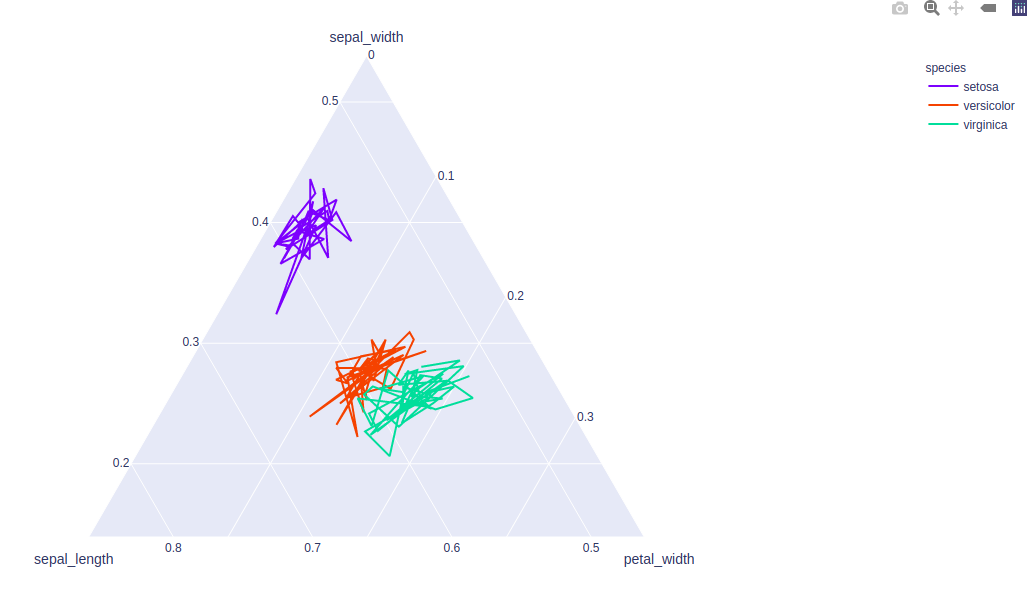
👁 ImageExample 2: Using color and line_group parameter