 |
VOOZH | about |
|
VOOZH | about |
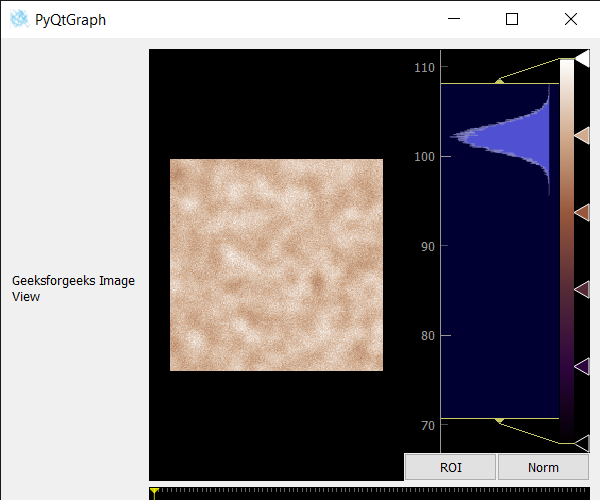
In this article we will see how we can export data of the image view object in PyQTGraph. PyQtGraph is a graphics and user interface library for Python that provides functionality commonly required in designing and science applications. Its primary goals are to provide fast, interactive graphics for displaying data (plots, video, etc.). Widget used for display and analysis of image data. Implements many features like displaying 2D and 3D image data. For 3D data, a z-axis slider is displayed allowing the user to select which frame is displayed. Displays histogram of image data with movable region defining the dark/light levels, editable gradient provides a color lookup table, frame slider may also be moved using left/right arrow keys as well as pgup, pgdn, home, and end. Export data from the ImageView to a file, or to a stack of files if the data is 3D. Saving an image stack will result in index numbers being added to the file name. Images are saved as they would appear onscreen, with levels and lookup table applied.
We can create a image view with the help of command given below.
# creating a pyqtgraph image view object
imv = pg.ImageView()
In order to do this we use export method with the image view object
Syntax : imv.export(name)
Argument : It takes file name as argument
Return : It returns None
Below is the implementation.
Output :