 |
VOOZH | about |
|
VOOZH | about |
In this article we will see how we get the position of the bar graph in the PyQtGraph module. PyQtGraph is a graphics and user interface library for Python that provides functionality commonly required in designing and science applications. Its primary goals are to provide fast, interactive graphics for displaying data (plots, video, etc.) and second is to provide tools to aid in rapid application development (for example, property trees such as used in Qt Designer).A bar chart or bar graph is a chart or graph that presents categorical data with rectangular bars with heights or lengths proportional to the values that they represent. The bars can be plotted vertically or horizontally. A vertical bar chart is sometimes called a column chart. Default position of the bar graph is 0, 0 i.e it starts from the origin although we can change this position any time with the help of setPos method.
We can create a plot window and bar graph with the help of commands given below
# creating a pyqtgraph plot window
window = pg.plot()

# creating a bar graph of green color
bargraph = pg.BarGraphItem(x=x, height=y1, width=0.6, brush='g')
In order to do this we use pos method with the bar graph object
Syntax : bargraph.pos()
Argument : It takes no argument
Return : It returns QPoint object
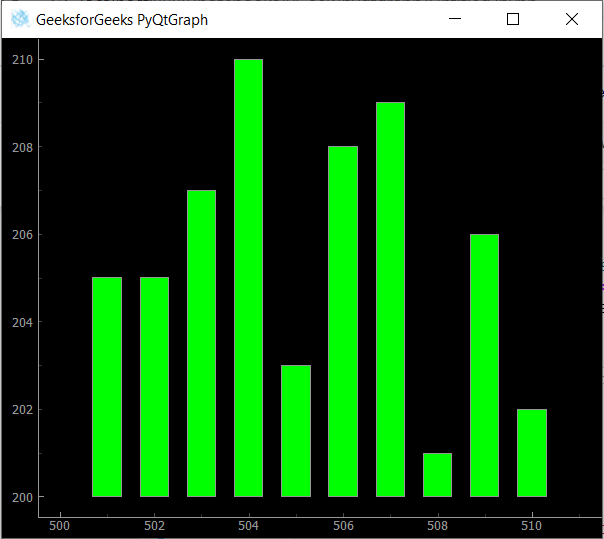
Below is the implementation
Output :
Bar Graph Position : Point(500.000000, 200.000000)