 |
VOOZH | about |
|
VOOZH | about |
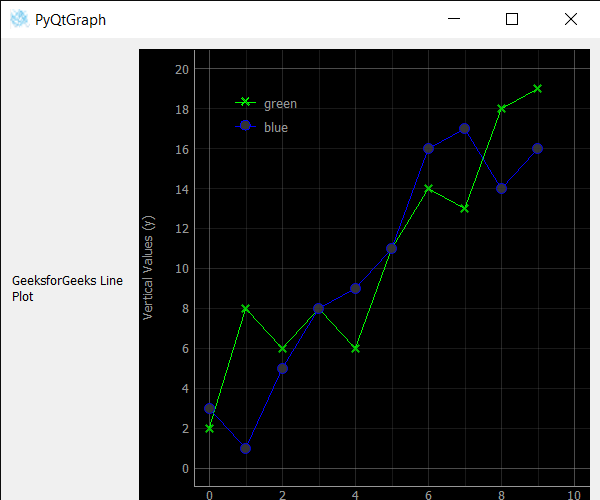
In this article we will see how we can set symbols brush of line in line graph of the PyQtGraph module. PyQtGraph is a graphics and user interface library for Python that provides functionality commonly required in designing and science applications. Its primary goals are to provide fast, interactive graphics for displaying data (plots, video, etc.) A line chart or line plot or line graph or curve chart is a type of chart that displays information as a series of data points called 'markers' connected by straight line segments. It is a basic type of chart common in many fields. Line graph is created with the help of plot class in PyQtGraph. Symbols are the figure of the point which connect the data of the line. It is mainly x, o.
We can create a plot window and create lines on it with the help of commands given below
# creating a pyqtgraph plot window
plt = pg.plot()

# plotting line in green color
# with dot symbol as x, not a mandatory field
line = plt.plot(x, y, pen='g', symbol='x', symbolPen='g', symbolBrush=0.2, name='green')
In order to do this we use setSymbolBrush method with the line object
Syntax : line.setSymbolBrush(QColor(10, 130, 3))
Argument : It takes Color/brush object as argument
Return : It returns None
Below is the implementation
Output :
👁 Image