 |
VOOZH | about |
|
VOOZH | about |
PyQtGraph is a graphics and user interface Python library for functionalities commonly required in designing and science applications. Its provides fast, interactive graphics for displaying data (plots, video, etc.). A line chart is a type of graph which displays information as a series of data points commonly known as markers, connected by straight line segments. A scatter plot uses dots to represent values for two different numeric variables. It is a type of graph, drawn using Cartesian coordinates to display values for typically two variables for a set of data
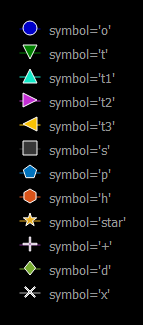
When we create a line graph or scatter plot graph, the points which represent some data needs to be highlighted using certain symbols, by default it is round circle but this can be modified as required. There are a total of 12 symbols which are offered by pyqtgraph which can be used to change symbol as required.
Below are the list of the symbols available in this module:
We can create a plot window with the help of commands given below :
plt = pg.plot()
In order to implement the above explained concept, following steps can be followed:
Example:
Output :