 |
VOOZH | about |
|
VOOZH | about |
Pyspark is a powerful tool for handling large datasets in a distributed environment using Python. One common operation when working with data is grouping it based on one or more columns. This can be easily done in Pyspark using the groupBy() function, which helps to aggregate or count values in each group.
In this article, we will explore how to use the groupBy() function in Pyspark for counting occurrences and performing various aggregation operations.
DataFrame.groupby(by=None, axis=0, level=None, as_index=True, sort=True, group_keys=True, squeeze=False, **kwargs)
Parameters:
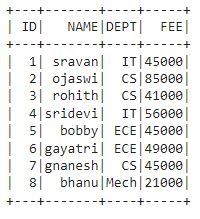
Before performing the groupBy() operation, let's create a simple DataFrame containing some student data, including columns like ID, NAME, DEPT, and FEE.
Output:
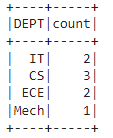
To count the number of rows in each group, we can use the count() function. This method counts the occurrences of each unique value in the specified column.
Output:
Explanation:
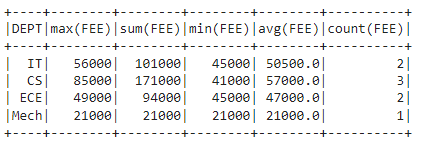
You can apply various aggregation functions to your grouped data, such as sum(), max(), min(), mean(), etc.
Output:
Explanation: