Python is a great language for doing data analysis, primarily because of the fantastic ecosystem of data-centric Python packages. Pandas is one of those packages and makes importing and analyzing data much easier.
Dataframe.add() method is used for addition of dataframe and other, element-wise (binary operator add). Equivalent to dataframe + other, but with support to substitute a fill_value for missing data in one of the inputs.
Syntax: DataFrame.add(other, axis='columns', level=None, fill_value=None)
Parameters:
other :Series, DataFrame, or constant
axis :{0, 1, ‘index’, ‘columns’} For Series input, axis to match Series index on
fill_value : [None or float value, default None] Fill missing (NaN) values with this value. If both DataFrame locations are missing, the result will be missing.
level : [int or name] Broadcast across a level, matching Index values on the passed MultiIndex level
Returns: result DataFrame
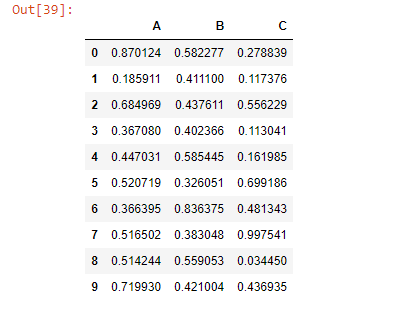
👁 Output
Note: add() function is similar to '+' operation but,
add() provides additional support for missing values in one of the inputs.
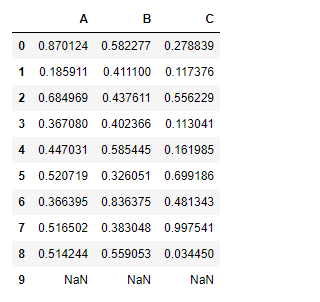
👁 Image
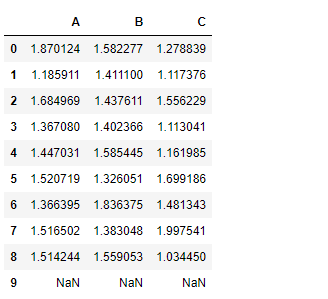
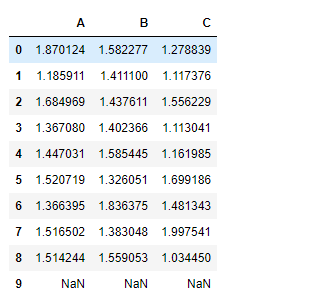
Adding a constant value to the dataframe using add() function:
👁 Image
Notice the output above, no addition took place for the nan cells in the
df dataframe.add() function has an attribute
fill_value. This will fill the missing value(Nan) with the assigned value. If both dataframe values are missing then, the result will be missing.
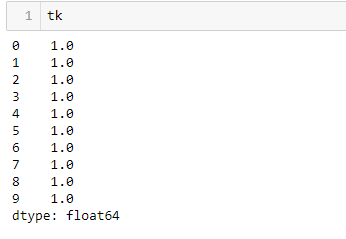
Let's see how to do it.
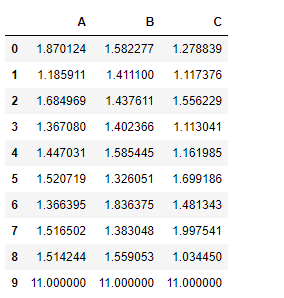
👁 Image
All the
nan cells has been filled with 10 first and then 1 is added to it.
Adding Series to Dataframe:
For Series input, the dimension of the indexes must match for both data frame and series.
👁 Image
👁 Image
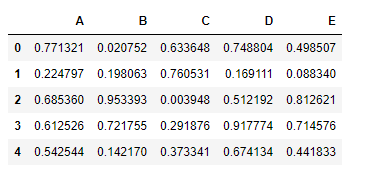
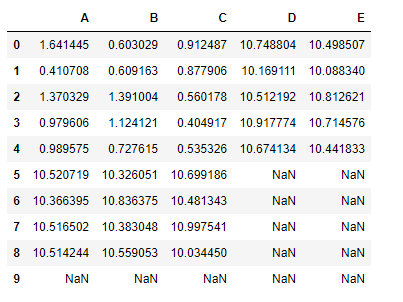
Adding one data frame with other data frame
👁 Image
Let's perform element-wise addition of these two data frames
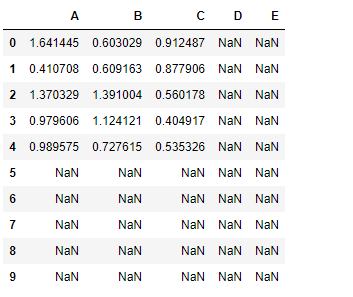
👁 Image
Notice the resulting dataframe has dimension 10*5 and it has
nan value in all those cells for which either of the dataframe has
nan value.
Let's fix it -
