 |
VOOZH | about |
|
VOOZH | about |
pandas.pivot_table() function allows us to create a pivot table to summarize and aggregate data. This function is important when working with large datasets to analyze and transform data efficiently. In this article, we will see some examples to see how it works.
Lets see a example:
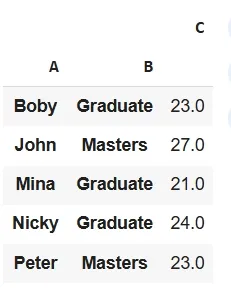
Output:
Here pd.pivot_table(df, index=['A', 'B']) created a pivot table that groups data by columns 'A' and 'B' and aggregates their values by calculating their mean.
DataFrame.pivot_table( values=None, index=None, columns=None, aggfunc='mean', fill_value=None, margins=False, dropna=True)
Parameters:
Returns: DataFrame
We can customize aggregation by specifying the values parameter (column to aggregate) and the aggfunc parameter (aggregation function). By default aggregation is mean but we can use functions like sum, count etc.
Output:
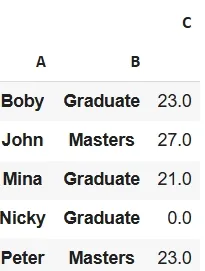
Using the fill_value parameter to replace missing values in the pivot table. This is helpful when we don’t want missing data to appear as NaN.
Output:
The marginsparameter adds total rows and columns to the pivot table. This is useful when we want to see overall totals for each row or column.
Output:
With pandas.pivot_table() we can create customizable summaries of our data which is required for specific analysis needs.