 |
VOOZH | about |
|
VOOZH | about |
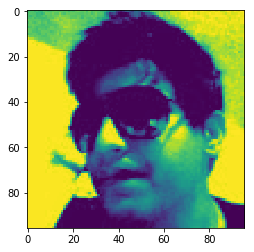
Matplotlib is a multi-platform data visualization library built on NumPy arrays and designed to work with the broader SciPy stack. Matplotlib consists of several plots like line, bar, scatter, histogram etc. In this article, we will see how to work with PNG images using Matplotlib.
Output
👁 ImagePseudocolor is useful for enhancing contrast of image.
Output
👁 ImageOutput
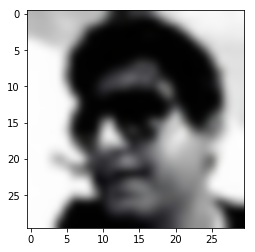
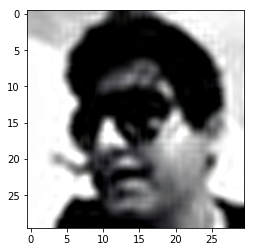
👁 ImageInterpolation calculates what the color or value of a pixel “should” be and this needed when we resize the image but want the same information. There's missing space when you resize image because pixels are discrete and interpolation is how you fill that space.
Example 4: Interpolation
Output
👁 ImageOutput
👁 Image