Rank Based Percentile Gui Calculator using Tkinter
Last Updated : 15 Jul, 2025
Python offers multiple options for developing a GUI (Graphical User Interface). Out of all the GUI methods, Tkinter is the most commonly used method. In this article, we will learn how to create a Rank Based - Percentile Gui Calculator application using Tkinter, with a step-by-step guide.
Let’s create a GUI-based simple Rank Based - Percentile Gui Calculator application:
Below is the implementation:
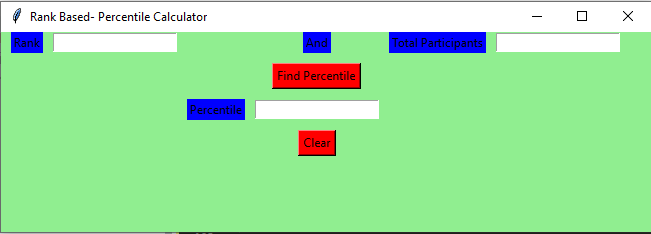
Output :
Code Explanation:
The code starts by getting the number of students and the rank of those students.
The code then creates two variables, students and rank.
The getPercentile() function will take these numbers as input and calculate their percentile according to a set formula.
The getPercentile() function first takes the value from the total_participantField box.
This is the total number of participants in the study.
Next, it gets the value from the rankField box.
This is how many people have a particular rank in this study.
Finally, getPercentile() calculates each student's percentile according to this set formula: where x is equal to the value from total_participantField, y is equal to the value from rankField, and z is equal to 100%.
The code calculates the percentile for a given set of values.
The first step is to get the number of students and rank.
Next, the code calculates the median and mode for these two values.
The getPercentile() function then takes these two values as input and stores them in a new variable called students and rank respectively.
Next, the percentile is calculated using the following equation: (students/total_participantField.get()) * 100
The code starts by creating a window called “gui”.
The window has a green background color.
Next, the code sets up some basic properties of the window.
It specifies that the title of the window is “Analyze” and that it should be displayed in a floating panel on the left side of the screen.
The next line of code creates an instance of Tkinter, which is Python’s built-in GUI library.
Next, the code sets up some basic properties for the window.
It specifies that it should have a border around it and that its title bar should be hidden.
Finally, the code assigns values to two variables: rankField and total_participantField.
rankField stores information about students’ ranks while total_participantField stores information about all participants in the study (i.e., both students and non-students).
Next, the code calculates student ranks using round() function and inserts them into rankField variable.
Then, it calculates participant counts using count() function and inserts them into total_participantField variable.
Finally, it uses percentile() function to calculate percentage distributions for each rank group (i.e., 1st through 10th grades).
The code creates a window and sets the background color to light green.
Next, it sets the name of the window to "Comprehend".
Finally, it creates an instance of Tkinter and begins setting up its various properties.
The next block of code creates two text entry boxes - one for the rank field and one for the total_participant field.
The code then calculates the percentage of students who are lower than the student's rank and stores this value in the percentileField text entry box.
The last block of code clears all of the text entry boxes by deleting their contents.
The code creates three labels: rank, andl, and total_participant.
The rank label has the text "Rank" and is blue.
The andl label has the text "And" and is blue.
The total_participant label has the text "Total Participants" and is blue.
The code sets up the GUI window with a geometry of 650x200 pixels.
It creates two Label objects, one for the rank label and one for the andl label.
The rank object has the text "Rank" as its value, while the andl object has the text "And" as its value.
Finally, the code creates a Total Participant object with the text "Total Participants" as its value.
The code creates a Rank: label, an And: label, and a Total Participants: label.
The Rank: label will display the rank of the data set, while the And: label will display whether all data sets have an equal number of participants or not.
The Total Participants: label will display the total number of participants in each data set.
The code starts with the creation of three widgets: a find percentile button, a percentile label, and a clear button.
The find percentile button is attached to the getPercentile function.
This function takes two arguments: the dataframe and the percentile rank.
The code creates an instance of the Button class and sets its properties accordingly.
The fg property specifies the foreground color, while bg specifies the background color.
The command property specifies how to execute the function when clicked.
The percentile label is created next and attached to the getPercentile function as well.
Like the find percentile button, it also has a command property that allows you to specify how to execute it when clicked.
Finally, we create a grid method that will help us place all of our widgets in table-like structure onscreen.
We use this grid method to position both buttons at 0% (the first column) and 100% (the last column).
The code creates a Find Percentile button and attached to it is a getPercentile function.
The find widget will display the text "Find Percentile" and have a black background.
The percentile label will also be created and have a blue background.
Finally, two buttons are created, Clear and Percentile.
Clear will have a black background and have the command "Clear" associated with it, while Percentile will have a red background and the command "Get Percentile" associated with it.
The code then uses the grid method to place the widgets at respective positions in table like structure .
This allows for easy positioning of all of the widgets on the screen.
