scipy.stats.skew(array, axis=0, bias=True) function calculates the skewness of the data set.
skewness = 0 : normally distributed.
skewness > 0 : more weight in the left tail of the distribution.
skewness < 0 : more weight in the right tail of the distribution.
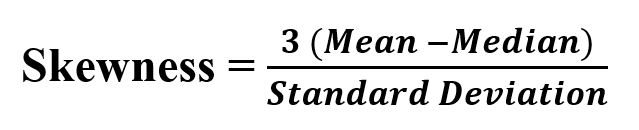
Its formula -
👁 Image
Parameters :
array : Input array or object having the elements.
axis : Axis along which the skewness value is to be measured. By default axis = 0.
bias : Bool; calculations are corrected for statistical bias, if set to False.
Returns : Skewness value of the data set, along the axis.
Code #1:
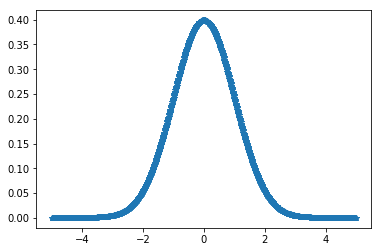
Output :👁 Image
Skewness for data : 1.1108237139164436
Code #2:
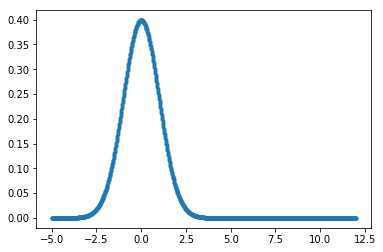
Output :👁 Image
Skewness for data : 1.917677776148478
Code #3: On Random data
