 |
VOOZH | about |
|
VOOZH | about |
Excel files store data in rows and columns, making them useful for managing structured datasets.
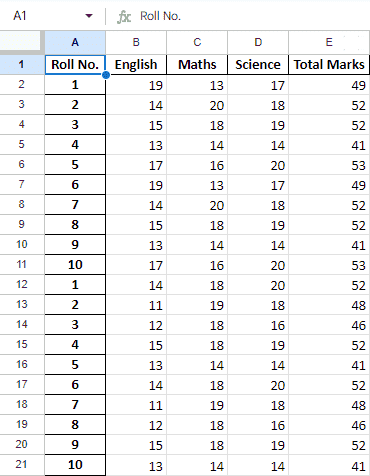
In the below code, we are working with an Excel file named students.xlsx which contains student data.
Output
Roll No. English Maths Science
0 1 19 13 17
1 2 14 20 18
2 3 15 18 19
3 4 13 14 14
4 5 17 16 20
5 6 19 13 17
6 7 14 20 18
7 8 15 18 19
8 9 13 14 14
9 10 17 16 20
Note: You may need to install openpyxl using pip install openpyxl to read Excel files.
By default, read_excel() loads only the first sheet of an Excel workbook. If your file contains multiple sheets, you can read each sheet separately and then combine them into a single DataFrame using pd.concat(). The read_excel() function provides useful arguments to control how data is loaded:
Example: Here we concatenate the two sheets into a single DataFrame using the concat() function and to view the complete combined DataFrame, we simply run the following command:
Output
Roll No. English Maths Science
1 19 13 17
2 14 20 18
3 15 18 19
4 13 14 14
5 17 16 20
6 19 13 17
7 14 20 18
8 15 18 19
9 13 14 14
10 17 16 20
1 14 18 20
2 11 19 18
3 12 18 16
4 15 18 19
5 13 14 14
6 14 18 20
7 11 19 18
8 12 18 16
9 15 18 19
10 13 14 14
The head() and tail() methods are used to quickly preview data in a DataFrame. They help you inspect the top or bottom rows without printing the entire dataset. You can pass a number inside the brackets to specify how many rows you want to see
Output
Roll No. English Maths Science
1 19 13 17
2 14 20 18
3 15 18 19
4 13 14 14
5 17 16 20
Roll No. English Maths Science
6 14 18 20
7 11 19 18
8 12 18 16
9 15 18 19
10 13 14 14
shape attribute is used to check the dimensions of a DataFrame. It returns a tuple showing the total number of rows and columns.
Output
(20, 3)
sort_values() method is used to sort a DataFrame based on the values of a specific column. It is especially useful when working with numerical data, but it can also sort text data.
Now, let's suppose we want the top 5 values of the sorted column, we can use the head() method here:
Output
Roll No. English Maths Science
1 19 13 17
6 19 13 17
5 17 16 20
10 17 16 20
3 15 18 19
We can do that with any numerical column of the data frame as shown below:
Output
Roll No.
1 13
2 20
3 18
4 14
5 16
Name: Maths, dtype: int64
When your dataset contains numerical data, describe() method provides a quick statistical summary of the DataFrame. It includes Count (number of non null values), Mean, Standard Deviation, Minimum and Maximum values and Percentiles (25%, 50%, 75%)
Output
English Maths Science
count 20.00000 20.000000 20.000000
mean 14.30000 16.800000 17.500000
std 2.29645 2.330575 2.164304
min 11.00000 13.000000 14.000000
25% 13.00000 14.000000 16.000000
50% 14.00000 18.000000 18.000000
75% 15.00000 18.000000 19.000000
max 19.00000 20.000000 20.000000
Pandas also provides individual statistical methods like mean(), sum(), min() and max() to calculate specific values. This can also be done separately for all the numerical columns using following command:
Output
np.float64(14.3)
You can also create calculated columns, just like Excel formulas, by performing operations on existing columns.
Output
Roll No.
1 49
2 52
3 52
4 41
5 53
Name: Total Marks, dtype: int64
After operating on the data in the data frame, we can export the data back to an Excel file using the method to_excel. For this, we need to specify an output Excel file where the transformed data is to be written, as shown below:
Output