 |
VOOZH | about |
|
VOOZH | about |
Have you ever wanted to inspect, debug, or tweak a website's code while browsing in Opera? Whether you're a developer or just curious about a webpage's structure, Developer Tools can help you gain deep insights into how a website works. These tools are essential for debugging and testing web pages, allowing you to see things like HTML structure, CSS styles, and JavaScript functions.
In this guide, we will walk you through the methods of opening Developer Tools in Opera so you can start exploring the elements of a website directly from your browser.
Opera Developer Tools are a set of built-in features in the Opera browser designed for developers to help them inspect, debug, and optimize web pages. These tools are based on Chromium, the same engine used by Google Chrome, so they offer a similar experience with some unique advantages. Here’s what Opera’s DevTools provide:
Key Advantage: One major advantage of Opera’s Developer Tools is that they launch faster than many competitors. This is due to Opera’s lightweight design, allowing developers to access the tools quickly without a long loading time. This can save valuable time, especially when working on tight deadlines.
There are several ways to open Opera's Developer Tools:
Right-click on any part of the webpage and select "Inspect". This will open the Developer Tools at the bottom or side of your screen.
👁 How to Open Developer Tools in Opera
Click the Opera menu (≡) in the top-left corner → Go to "Developer" → Select "Developer Tools".
These methods will help you quickly open Developer Tools in Opera to inspect and debug webpages.
👁 How to Open Developer Tools in Opera
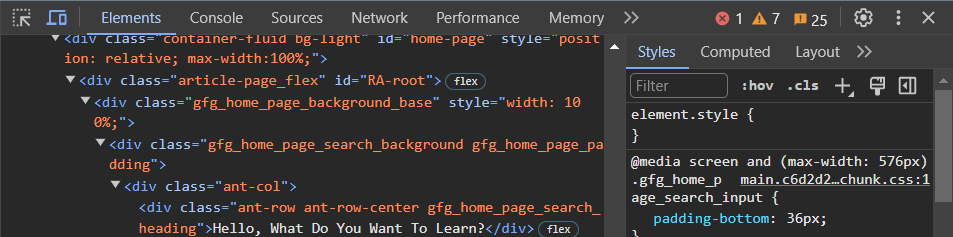
In this tab, developers can not only view the HTML code of the active web page but also inspect and modify the CSS styles applied to different elements. It offers a detailed view of the Document Object Model (DOM), allowing developers to navigate through the structure of the page and make real-time changes to see their effects instantly.
👁 How to Open Developer Tools in Opera
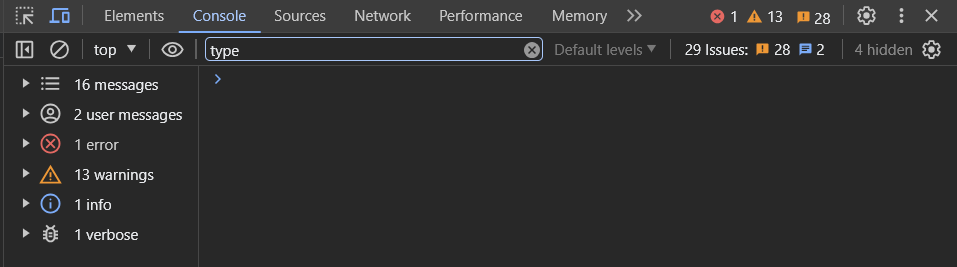
The Console tab in Opera Developer Tools is a powerful tool for debugging JavaScript code. It not only displays errors, warnings, and log messages but also allows developers to interact with the page's JavaScript environment. Developers can execute JavaScript code directly in the console, inspect variables, and even set breakpoints to debug complex issues.
👁 How to Open Developer Tools in Opera
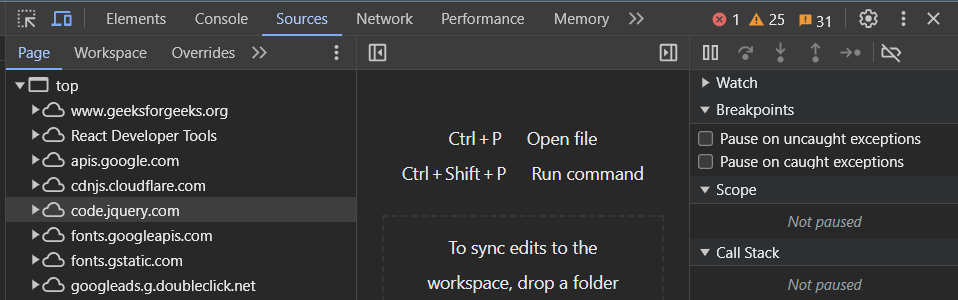
Opera's Sources tab provides a comprehensive view of all the resources loaded by the web page, including HTML, CSS, JavaScript, and other files. It allows developers to debug JavaScript files, set breakpoints, and step through code execution. The Sources tab also supports live editing of CSS and JavaScript files, making it easy to experiment with changes.
👁 How to Open Developer Tools in Opera
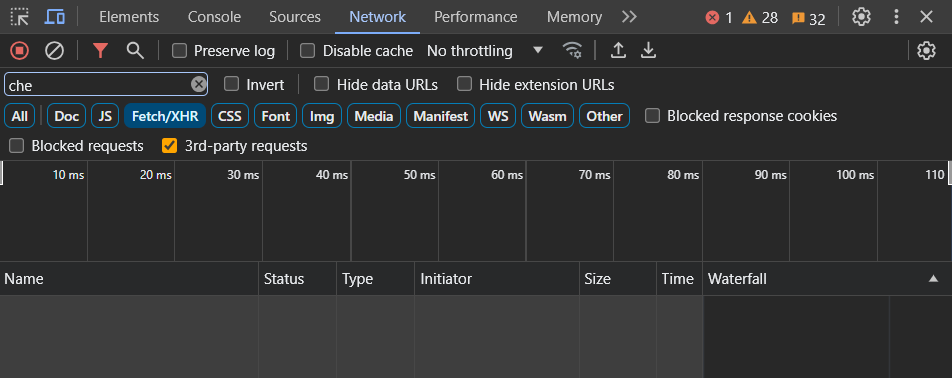
The Network tab in Opera Developer Tools provides detailed insights into all network activity related to the web page. It displays information about every resource loaded by the page, including its type, size, and loading time. Developers can use this tab to analyze network performance, identify slow-loading resources, and optimize the page's loading speed.
👁 How to Open Developer Tools in Opera
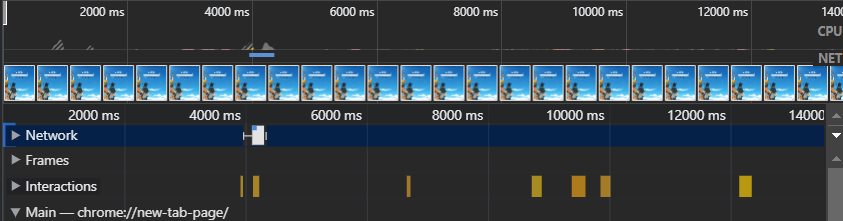
Opera's Performance tab is a valuable tool for analyzing the performance of a web page. It provides a timeline view of various events such as loading, scripting, rendering, and painting, allowing developers to identify bottlenecks and optimize the page's performance. The Performance tab also offers profiling tools for analyzing JavaScript execution and memory usage.
👁 How to Open Developer Tools in Opera
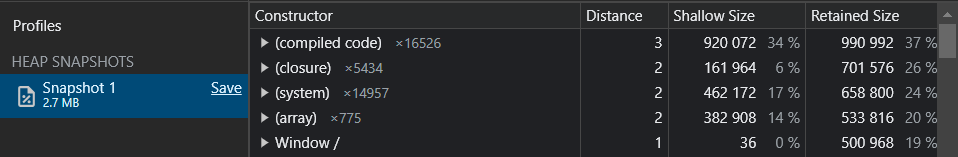
The Memory tab in Opera Developer Tools helps developers analyze the memory usage of a web page. It provides insights into JavaScript memory allocation, DOM nodes, and event listeners, allowing developers to identify memory leaks and optimize memory usage for better performance.
👁 How to Open Developer Tools in Opera
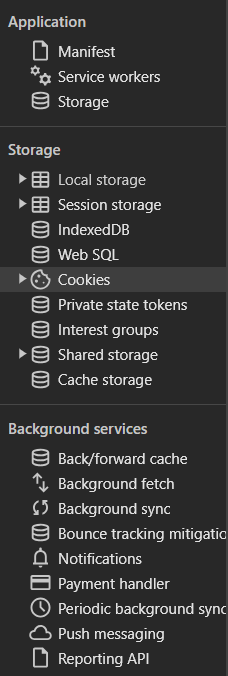
Opera's Application tab is a comprehensive tool for managing various aspects of web applications. It allows developers to inspect and manage local storage, session storage, cookies, and caches. The Application tab also provides tools for managing service workers and manifests, enabling developers to troubleshoot and optimize web applications for better performance and reliability.
👁 How to Open Developer Tools in Opera
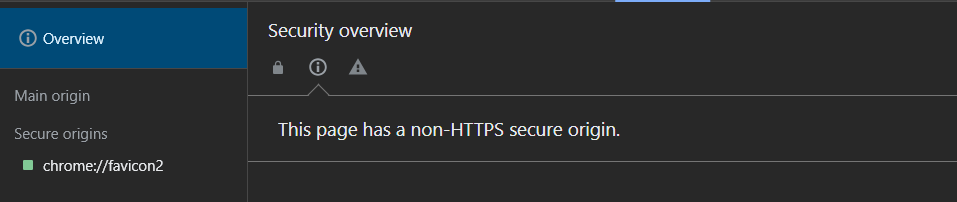
The Security tab in Opera Developer Tools provides information about the security status of a web page. It displays details about the site's security settings, including whether it is served over HTTPS, any mixed content warnings, and potential security vulnerabilities. Developers can use this tab to ensure that their websites are secure and comply with best practices for web security.
Developer Tools in Opera offer a versatile suite of utilities for inspecting, debugging, and optimizing web pages. With the ability to open these tools via keyboard shortcuts, the browser menu, or by directly inspecting page elements, users can easily access the necessary tools to improve their workflow and troubleshoot issues effectively.
.png)