 |
VOOZH | about |
|
VOOZH | about |
Seaborn is a Python data visualization library based on matplotlib. It provides a high-level interface for drawing attractive and informative statistical graphics. Seaborn helps resolve the two major problems faced by Matplotlib; the problems are ?
As Seaborn compliments and extends Matplotlib, the learning curve is quite gradual. If you know Matplotlib, you are already half way through Seaborn.
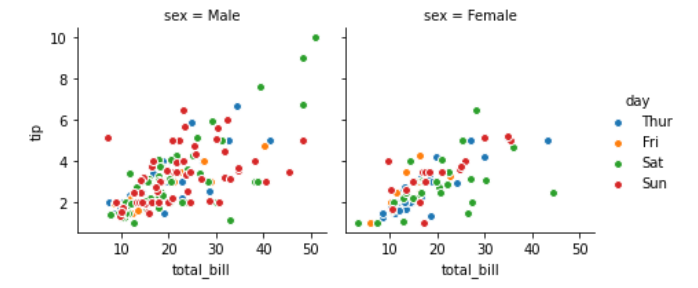
seaborn.FacetGrid( data, \*\*kwargs)
Seaborn.FacetGrid uses many arguments as input, main of which are described below in form of table:
| Argument | Description | Value |
| data | Tidy ("long-form") dataframe where each column is a variable and each row is an observation. | DataFrame |
| row, col, hue | Variables that define subsets of the data, which will be drawn on separate facets in the grid. See the ``*_order`` parameters to control the order of levels of this variable. | strings |
| palette | Colors to use for the different levels of the ``hue`` variable. | palette name, list, or dict, optional |
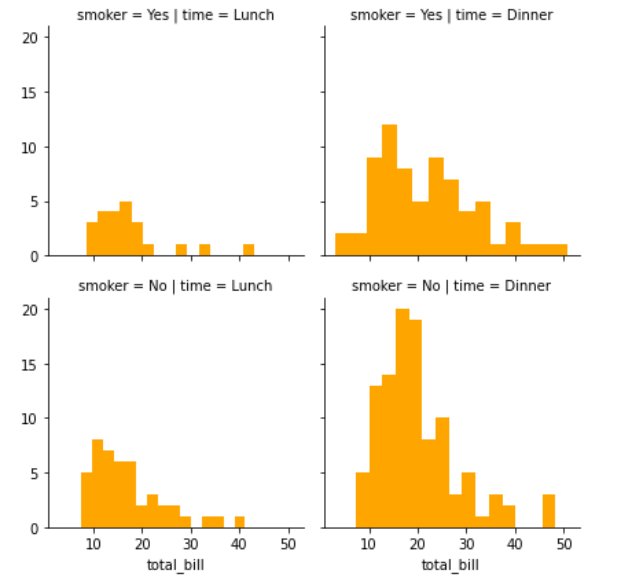
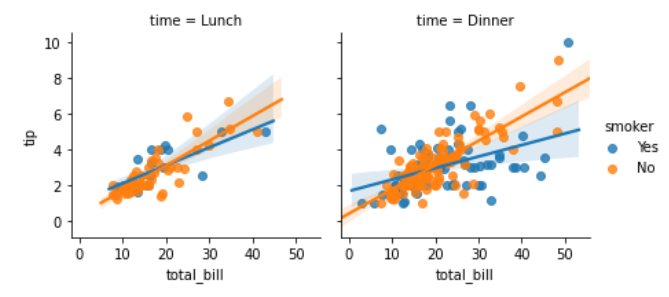
Below is the implementation of above method: