 |
VOOZH | about |
|
VOOZH | about |
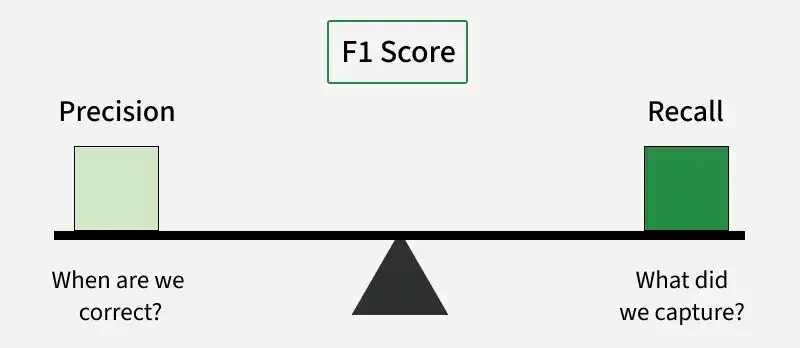
F1 Score is a metric used to evaluate the performance of a classification model. It combines precision and recall into a single value and is especially useful when the dataset has imbalanced classes.
A confusion matrix is a table used to evaluate the performance of a classification model. It compares the actual labels with the predicted labels to show how many predictions were correct or incorrect.
Precision measures how many of the positive predictions made by the model are actually correct. It tells us how accurate the model is when it predicts a positive class.
For example: Suppose a model predicts 5 cases as positive. Out of these, 4 are actually positive and 1 is negative. In this case, the precision is 80% (4/5).
Recall, also known as Sensitivity or True Positive Rate, measures how many of the actual positive cases were correctly identified by the model. It focuses on the model’s ability to detect positive instances.
For example: Suppose there are 10 actual positive cases in the dataset. If the model correctly identifies 4 of them as positive, the recall becomes 40% (4/10). This means the model detected only a portion of the actual positive cases.
F1 Score combines precision and recall into a single metric using the harmonic mean. It helps evaluate a model by balancing both precision and recall.
The F1 score becomes high only when both precision and recall are high. If either of them decreases significantly, the F1 score will also decrease.
The harmonic mean is used instead of a simple average because it balances precision and recall more effectively. It ensures that both values need to be high for the F1 score to be high.
The F1 Score can be calculated for both binary classification and multiclass classification problems.
In binary classification , there are only two classes: positive and negative. The F1 score is calculated using values from the confusion matrix, which helps determine metrics like precision and recall.
For example: Consider a dataset with 100 total cases. Out of these, 90 are positive and 10 are negative. The model predicts 85 cases as positive, where 80 are actually positive and 5 are actually negative. The confusion matrix would look like:
Example | Actual | Total | |
|---|---|---|---|
Model Prediction | 80 | 5 | 85 |
10 | 5 | 15 | |
Total | 90 | 10 | 100 |
From this matrix we can calculate:
This shows that the model performs well because both precision and recall are high.
In a multi-class classification , where there are more than two classes, the F1 score is calculated separately for each class instead of using a single score for the whole model. This is commonly done using the One-vs-Rest (OvR) or One-vs-All (OvA) approach. The process works as follows:
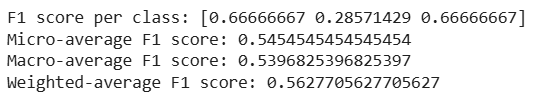
We can easily calculate the F1 score in Python using the f1_score function from the sklearn.metrics module. This function supports both binary and multiclass classification. The f1_score function mainly uses the following parameters:
Output:
- Micro-average: Calculates metrics globally by counting the total true positives, false negatives and false positives.
- Macro-average: Averages the F1 score for each class without considering class imbalance.
- Weighted-average: Considers class imbalance by weighting the F1 scores by the number of true instances for each class.