 |
VOOZH | about |
|
VOOZH | about |
Correlation and regression analysis are two fundamental statistical techniques used to examine the relationships between variables. R Programming Language is a programming language and environment for statistical computing and graphics, making it an excellent choice for conducting these analyses.
Correlation analysis is a statistical technique used to measure the strength and direction of the relationship between two continuous variables. The most common measure of correlation is the Pearson correlation coefficient. It quantifies the linear relationship between two variables. The Pearson correlation coefficient, denoted as "r" :
Parameters:
It can take values between -1 (perfect negative correlation) and 1 (perfect positive correlation), with 0 indicating no linear correlation.
We calculate the Pearson correlation between study hours and exam scores to understand the strength of their linear relationship.
Output:
[1] 0.9569094
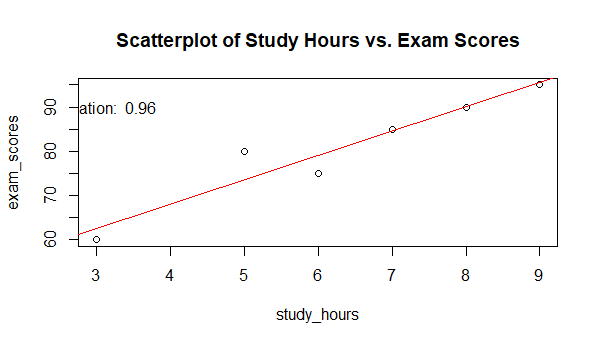
We create a scatterplot to visualize the relationship between study hours and exam scores and overlay a regression line to show the trend along with the correlation value.
Output:
The scatterplot shows a positive linear trend, meaning as study hours increase, exam scores tend to rise. The regression line quantifies this relationship.
Regression analysis is used to model the relationship between one or more independent variables and a dependent variable. In simple linear regression, there is one independent variable, while in multiple regression there are multiple independent variables. The goal is to find a linear equation that best fits the data.
There are two types of Regression analysis.
We use simple linear regression to predict exam scores based on study hours.
Output:
We use a scatterplot to visualize the relationship between study hours and exam scores, then add a regression line to show the model's prediction.
Output:
The results helps us analyze how study hours influence exam scores and provides a quantitative model for prediction.
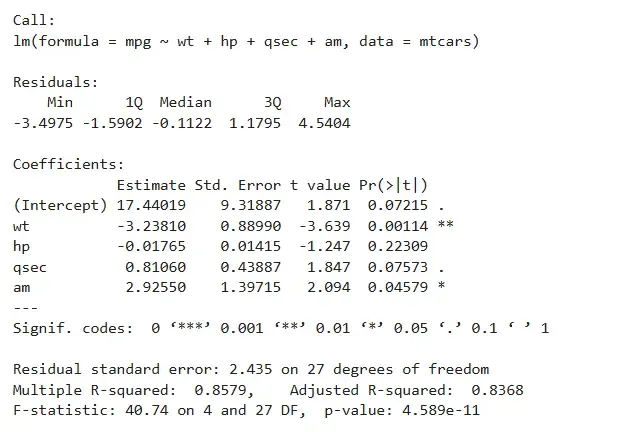
We build a multiple linear regression model using the mtcars dataset to predict mpg based on wt, hp, qsec and am.
Output:
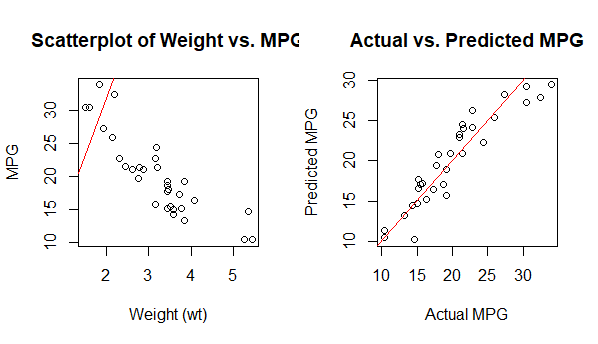
We create two plots side by side where one is showing the relationship between car weight and MPG and the other comparing actual and predicted MPG values.
Output:
The interpretation of coefficients and visualizations is help us to understand the impact of each variable on the dependent variable (MPG).
Correlation and regression analysis are both statistical techniques used to explore relationships between variables, but they serve different purposes and provide distinct types of information in R.
Correlation Analysis | Regression Analysis |
|---|---|
It is used to measure and quantify the strength and direction of the association between two or more variables. | Regression is used for prediction and understanding the causal relationships between variables. |
The primary output is a correlation coefficient that quantifies the strength and direction of the relationship between variables. | The output includes regression coefficients, which provide information about the intercept and the slopes of the independent variables |
It is often used when we want to understand the degree of association between variables and explore patterns in data. | It is employed when we want to make predictions, understand how one variable affects another and control for the influence of other variables. |