 |
VOOZH | about |
|
VOOZH | about |
A scatter plot is a set of dotted points representing individual data pieces on the horizontal and vertical axis. In a graph in which the values of two variables are plotted along the X-axis and Y-axis, the pattern of the resulting points reveals a correlation between them.
We can create a scatter plot in R Programming Language using the plot() function.
Syntax:
plot(x, y, main, xlab, ylab, xlim, ylim, axes)
Parameters:
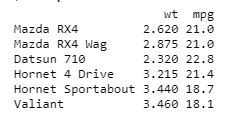
In order to create Scatterplot Chart, we use the data set "mtcars". We will use the columns "wt" and "mpg" in mtcars.
Example:
Output:
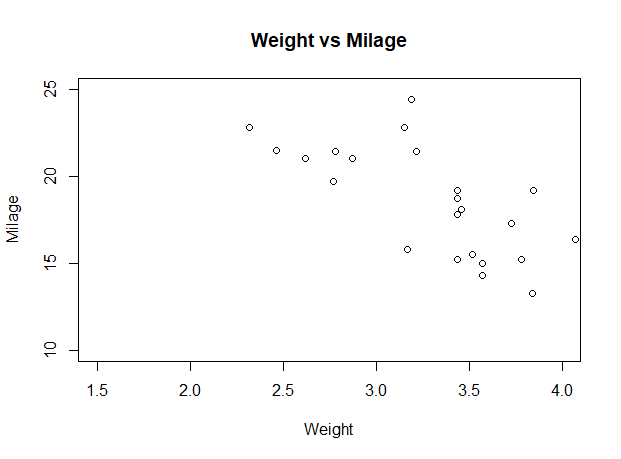
We are using the required parameters to plot the graph. In this 'xlab' describes the X-axis and 'ylab' describes the Y-axis.
Example:
Output:
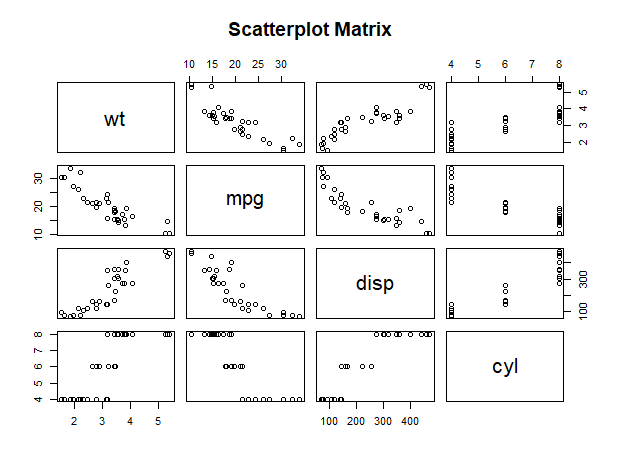
When we have two or more variables and we want to correlate between one variable and others so we use a R scatterplot matrix. The pairs() function is used to createR matrices of scatterplots.
Syntax:
pairs(formula, data)
Parameters:
Example:
Output:
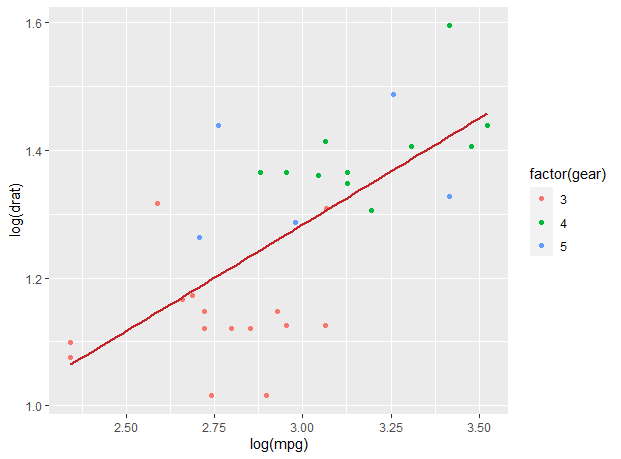
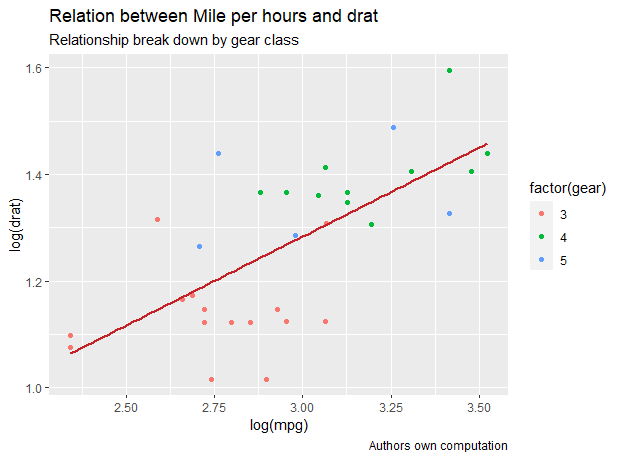
We are using the ggplot2 package provides ggplot() and geom_point() function for creating a scatterplot. Also we are using the columns "wt" and "mpg" in mtcars.
Example:
Output:
In ggplot we add the data set "mtcars" with this adding 'aes', 'geom_point'. We will use the Title, Caption, Subtitle.
Example:
Output:
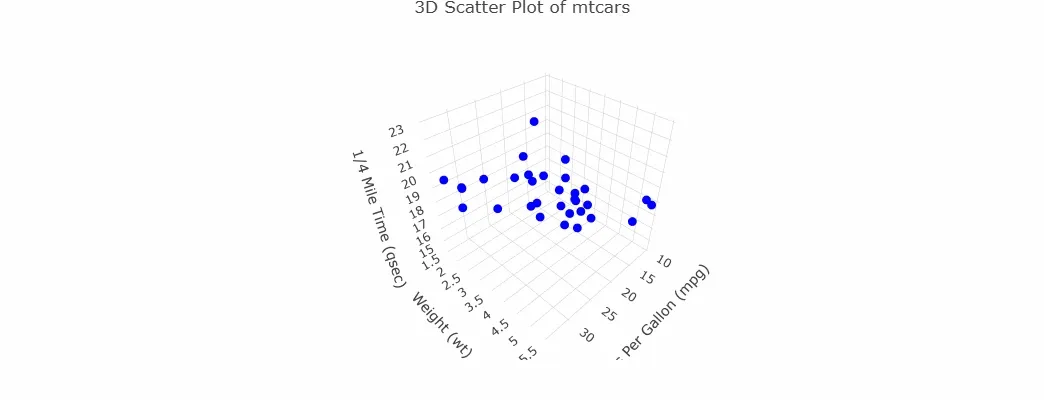
Here we will use the plotly package to create interactive 3D scatter plots. The plot_ly() method in plotly can be used to create 3D scatter plots, where you can define the x, y, and z coordinates for the points.
Output: