 |
VOOZH | about |
|
VOOZH | about |
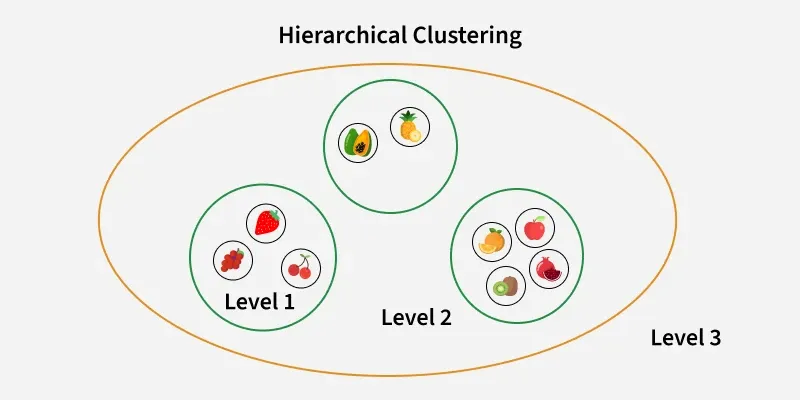
Hierarchical clustering in R is an unsupervised, non-linear algorithm used to create clusters with a hierarchical structure. The method is often compared to organizing a family tree. Suppose a family of up to three generations. The grandfather and mother have children and these children become parents to their own children. In hierarchical clustering, individuals (data points) are grouped into a hierarchy similar to family relationships.
In hierarchical clustering, objects (data points) are categorized into a tree-like structure, known as a dendrogram. The process works as follows:
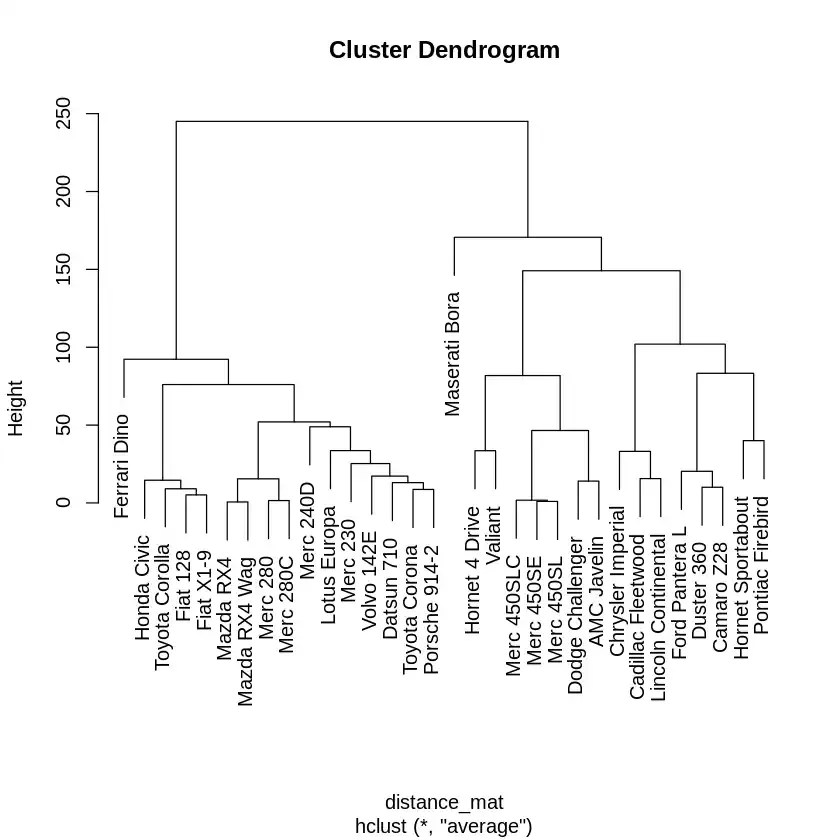
A dendrogram is a tree-like diagram that shows the hierarchy of clusters, with the height of the branches representing the distance between clusters. The leaves at the bottom represent individual data points.
Thumb Rule for Choosing the Optimal Number of Clusters: The largest vertical distance that does not intersect any horizontal lines on the dendrogram indicates the optimal number of clusters.
There are mainly two types of hierarchical clustering:
In this article, we will explore hierarchical clustering in R, focusing on the agglomerative approach.
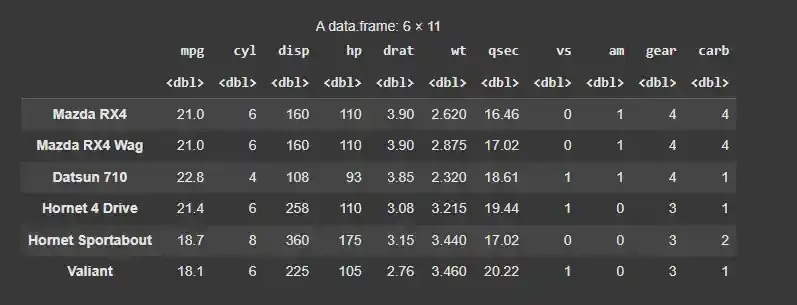
We will use the hclust() function from the stats package (pre-installed with R) to perform hierarchical clustering. We will use the mtcars dataset, which contains data about fuel consumption, performance and aspects of automobile design. This dataset is part of the dplyr package in R.
We will install and load the dplyr package. The dplyr package will also contain the mtcars dataset which we can use.
Output:
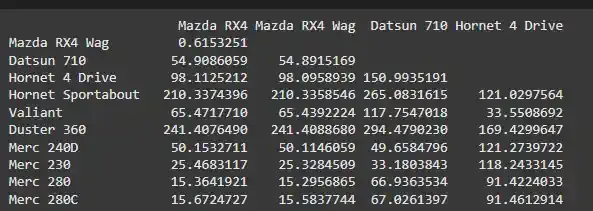
We will calculate the pairwise distances between data points using the Euclidean method. The dist() function computes the distance matrix.
Output:
The distance matrix is calculated using the Euclidean method, which determines the distances between all pairs of data points. Each entry in the matrix represents the distance between two data points.
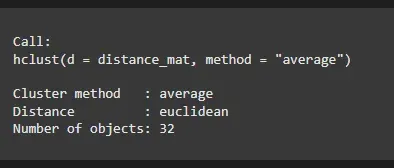
We will apply the hierarchical clustering algorithm using the hclust() function to the distance matrix. This function uses different linkage methods to merge clusters.
Output:
The Hierarchical Clustering Model output shows the clustering process, including the method used (average linkage) and the Euclidean distance between clusters.
We will plot the dendrogram to visualize the hierarchical clustering. The plot() function creates a visual representation of the hierarchical clustering.
Output:
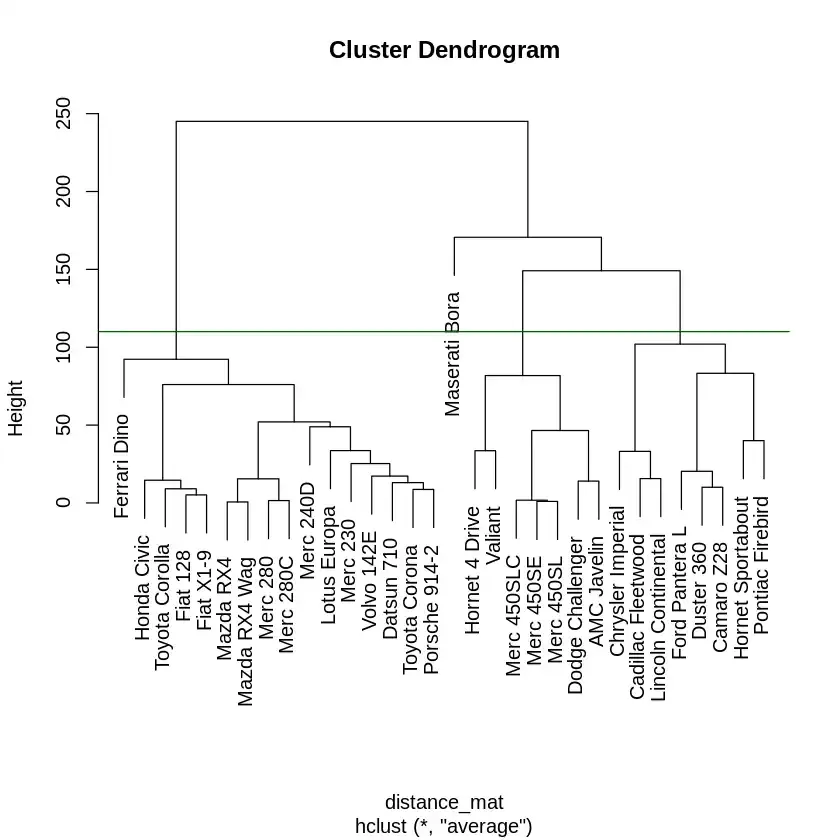
We will cut the dendrogram at a specific height or specify the number of clusters. Cutting the tree helps us decide how many clusters to form.
abline(h = 110, col = "green"): Adds a horizontal line to the dendrogram at height 110, indicating where to cut the tree.cutree(): Cuts the dendrogram into k clusters, where k is the desired number of clusters.Output:
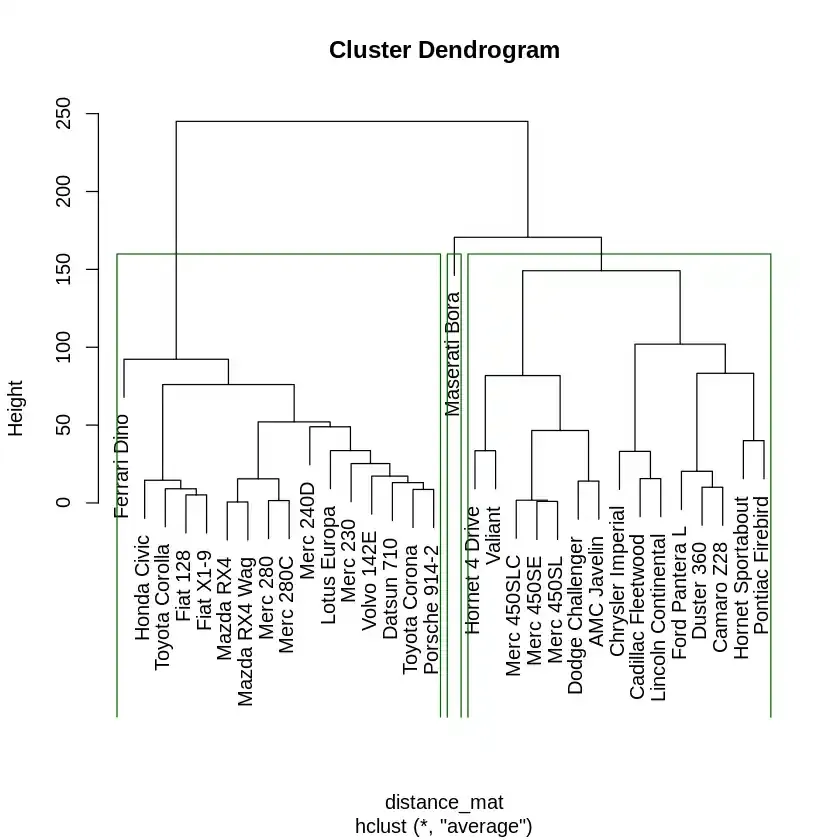
We will visualize the cut clusters on the dendrogram and display the count of data points in each cluster.
Output:
The dendrogram visualizes the clusters and their relationships. The x-axis represents the data points, while the y-axis represents the distance (height) between clusters. The green line in the plot indicates where the tree was cut to form 3 clusters.